Saimo Technology Co.,Ltd. (SZSE:300466) Stock Rockets 30% As Investors Are Less Pessimistic Than Expected


The Saimo Technology Co.,Ltd. (SZSE:300466) share price has done very well over the last month, posting an excellent gain of 30%. Taking a wider view, although not as strong as the last month, the full year gain of 11% is also fairly reasonable.
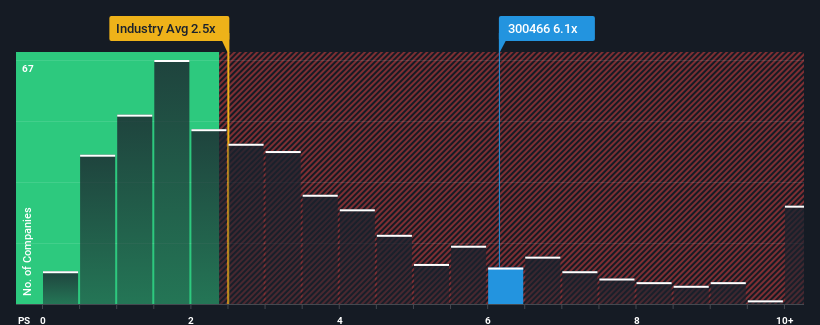
Since its price has surged higher, you could be forgiven for thinking Saimo TechnologyLtd is a stock to steer clear of with a price-to-sales ratios (or "P/S") of 6.1x, considering almost half the companies in China's Machinery industry have P/S ratios below 2.5x. Although, it's not wise to just take the P/S at face value as there may be an explanation why it's so lofty.
View our latest analysis for Saimo TechnologyLtd
What Does Saimo TechnologyLtd's Recent Performance Look Like?
For example, consider that Saimo TechnologyLtd's financial performance has been poor lately as its revenue has been in decline. Perhaps the market believes the company can do enough to outperform the rest of the industry in the near future, which is keeping the P/S ratio high. However, if this isn't the case, investors might get caught out paying too much for the stock.
Want the full picture on earnings, revenue and cash flow for the company? Then our free report on Saimo TechnologyLtd will help you shine a light on its historical performance.Do Revenue Forecasts Match The High P/S Ratio?
There's an inherent assumption that a company should far outperform the industry for P/S ratios like Saimo TechnologyLtd's to be considered reasonable.
Taking a look back first, the company's revenue growth last year wasn't something to get excited about as it posted a disappointing decline of 15%. That put a dampener on the good run it was having over the longer-term as its three-year revenue growth is still a noteworthy 22% in total. So we can start by confirming that the company has generally done a good job of growing revenue over that time, even though it had some hiccups along the way.
This is in contrast to the rest of the industry, which is expected to grow by 23% over the next year, materially higher than the company's recent medium-term annualised growth rates.
In light of this, it's alarming that Saimo TechnologyLtd's P/S sits above the majority of other companies. Apparently many investors in the company are way more bullish than recent times would indicate and aren't willing to let go of their stock at any price. Only the boldest would assume these prices are sustainable as a continuation of recent revenue trends is likely to weigh heavily on the share price eventually.
What Does Saimo TechnologyLtd's P/S Mean For Investors?
The strong share price surge has lead to Saimo TechnologyLtd's P/S soaring as well. We'd say the price-to-sales ratio's power isn't primarily as a valuation instrument but rather to gauge current investor sentiment and future expectations.
The fact that Saimo TechnologyLtd currently trades on a higher P/S relative to the industry is an oddity, since its recent three-year growth is lower than the wider industry forecast. When we observe slower-than-industry revenue growth alongside a high P/S ratio, we assume there to be a significant risk of the share price decreasing, which would result in a lower P/S ratio. Unless there is a significant improvement in the company's medium-term performance, it will be difficult to prevent the P/S ratio from declining to a more reasonable level.
You always need to take note of risks, for example - Saimo TechnologyLtd has 1 warning sign we think you should be aware of.
Of course, profitable companies with a history of great earnings growth are generally safer bets. So you may wish to see this free collection of other companies that have reasonable P/E ratios and have grown earnings strongly.
New: Manage All Your Stock Portfolios in One Place
We've created the ultimate portfolio companion for stock investors, and it's free.
• Connect an unlimited number of Portfolios and see your total in one currency
• Be alerted to new Warning Signs or Risks via email or mobile
• Track the Fair Value of your stocks
Have feedback on this article? Concerned about the content? Get in touch with us directly. Alternatively, email editorial-team (at) simplywallst.com.
This article by Simply Wall St is general in nature. We provide commentary based on historical data and analyst forecasts only using an unbiased methodology and our articles are not intended to be financial advice. It does not constitute a recommendation to buy or sell any stock, and does not take account of your objectives, or your financial situation. We aim to bring you long-term focused analysis driven by fundamental data. Note that our analysis may not factor in the latest price-sensitive company announcements or qualitative material. Simply Wall St has no position in any stocks mentioned.
About SZSE:300466
Saimo TechnologyLtd
Provides intelligent detection products and control systems in China.
Mediocre balance sheet with weak fundamentals.
Market Insights

Community Narratives


