- China
- /
- Electrical
- /
- SZSE:300376
The Returns On Capital At East GroupLtd (SZSE:300376) Don't Inspire Confidence


If we want to find a potential multi-bagger, often there are underlying trends that can provide clues. Firstly, we'd want to identify a growing return on capital employed (ROCE) and then alongside that, an ever-increasing base of capital employed. This shows us that it's a compounding machine, able to continually reinvest its earnings back into the business and generate higher returns. Having said that, from a first glance at East GroupLtd (SZSE:300376) we aren't jumping out of our chairs at how returns are trending, but let's have a deeper look.
Return On Capital Employed (ROCE): What Is It?
For those who don't know, ROCE is a measure of a company's yearly pre-tax profit (its return), relative to the capital employed in the business. To calculate this metric for East GroupLtd, this is the formula:
Return on Capital Employed = Earnings Before Interest and Tax (EBIT) ÷ (Total Assets - Current Liabilities)
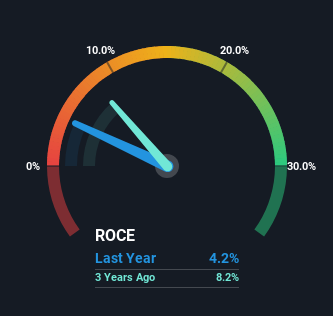
0.042 = CN¥431m ÷ (CN¥13b - CN¥3.1b) (Based on the trailing twelve months to June 2024).
So, East GroupLtd has an ROCE of 4.2%. In absolute terms, that's a low return and it also under-performs the Electrical industry average of 5.9%.
See our latest analysis for East GroupLtd
In the above chart we have measured East GroupLtd's prior ROCE against its prior performance, but the future is arguably more important. If you're interested, you can view the analysts predictions in our free analyst report for East GroupLtd .
So How Is East GroupLtd's ROCE Trending?
When we looked at the ROCE trend at East GroupLtd, we didn't gain much confidence. Over the last five years, returns on capital have decreased to 4.2% from 8.0% five years ago. Given the business is employing more capital while revenue has slipped, this is a bit concerning. If this were to continue, you might be looking at a company that is trying to reinvest for growth but is actually losing market share since sales haven't increased.
On a side note, East GroupLtd has done well to pay down its current liabilities to 23% of total assets. That could partly explain why the ROCE has dropped. What's more, this can reduce some aspects of risk to the business because now the company's suppliers or short-term creditors are funding less of its operations. Since the business is basically funding more of its operations with it's own money, you could argue this has made the business less efficient at generating ROCE.
The Bottom Line On East GroupLtd's ROCE
From the above analysis, we find it rather worrisome that returns on capital and sales for East GroupLtd have fallen, meanwhile the business is employing more capital than it was five years ago. Investors haven't taken kindly to these developments, since the stock has declined 34% from where it was five years ago. Unless there is a shift to a more positive trajectory in these metrics, we would look elsewhere.
Since virtually every company faces some risks, it's worth knowing what they are, and we've spotted 2 warning signs for East GroupLtd (of which 1 shouldn't be ignored!) that you should know about.
For those who like to invest in solid companies, check out this free list of companies with solid balance sheets and high returns on equity.
Valuation is complex, but we're here to simplify it.
Discover if East GroupLtd might be undervalued or overvalued with our detailed analysis, featuring fair value estimates, potential risks, dividends, insider trades, and its financial condition.
Access Free AnalysisHave feedback on this article? Concerned about the content? Get in touch with us directly. Alternatively, email editorial-team (at) simplywallst.com.
This article by Simply Wall St is general in nature. We provide commentary based on historical data and analyst forecasts only using an unbiased methodology and our articles are not intended to be financial advice. It does not constitute a recommendation to buy or sell any stock, and does not take account of your objectives, or your financial situation. We aim to bring you long-term focused analysis driven by fundamental data. Note that our analysis may not factor in the latest price-sensitive company announcements or qualitative material. Simply Wall St has no position in any stocks mentioned.
About SZSE:300376
East GroupLtd
Designs, produces, and sells power supply products and solutions in China and internationally.
Excellent balance sheet second-rate dividend payer.
Market Insights

Community Narratives

