- China
- /
- Electrical
- /
- SZSE:300342
Pulling back 19% this week, Changshu Tianyin ElectromechanicalLtd's SZSE:300342) five-year decline in earnings may be coming into investors focus


The Changshu Tianyin Electromechanical Co.,Ltd (SZSE:300342) share price has had a bad week, falling 19%. Looking further back, the stock has generated good profits over five years. After all, the share price is up a market-beating 49% in that time.
While this past week has detracted from the company's five-year return, let's look at the recent trends of the underlying business and see if the gains have been in alignment.
Check out our latest analysis for Changshu Tianyin ElectromechanicalLtd
While markets are a powerful pricing mechanism, share prices reflect investor sentiment, not just underlying business performance. One way to examine how market sentiment has changed over time is to look at the interaction between a company's share price and its earnings per share (EPS).
During five years of share price growth, Changshu Tianyin ElectromechanicalLtd actually saw its EPS drop 28% per year.
Essentially, it doesn't seem likely that investors are focused on EPS. Since the change in EPS doesn't seem to correlate with the change in share price, it's worth taking a look at other metrics.
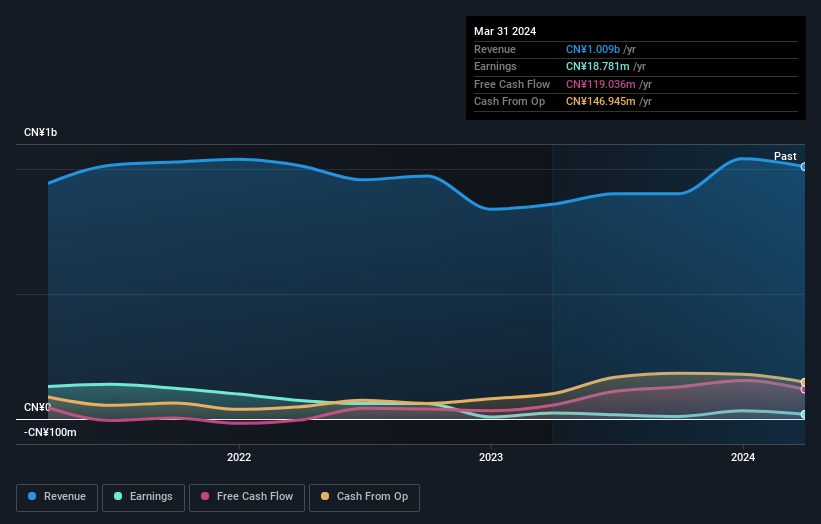
We doubt the modest 0.7% dividend yield is attracting many buyers to the stock. The revenue growth of 2.9% per year hardly seems impressive. So it seems one might have to take closer look at earnings and revenue trends to see how they might influence the share price.
The image below shows how earnings and revenue have tracked over time (if you click on the image you can see greater detail).
This free interactive report on Changshu Tianyin ElectromechanicalLtd's balance sheet strength is a great place to start, if you want to investigate the stock further.
What About Dividends?
When looking at investment returns, it is important to consider the difference between total shareholder return (TSR) and share price return. The TSR incorporates the value of any spin-offs or discounted capital raisings, along with any dividends, based on the assumption that the dividends are reinvested. It's fair to say that the TSR gives a more complete picture for stocks that pay a dividend. In the case of Changshu Tianyin ElectromechanicalLtd, it has a TSR of 57% for the last 5 years. That exceeds its share price return that we previously mentioned. This is largely a result of its dividend payments!
A Different Perspective
We're pleased to report that Changshu Tianyin ElectromechanicalLtd shareholders have received a total shareholder return of 43% over one year. And that does include the dividend. That's better than the annualised return of 10% over half a decade, implying that the company is doing better recently. In the best case scenario, this may hint at some real business momentum, implying that now could be a great time to delve deeper. It's always interesting to track share price performance over the longer term. But to understand Changshu Tianyin ElectromechanicalLtd better, we need to consider many other factors. Consider for instance, the ever-present spectre of investment risk. We've identified 4 warning signs with Changshu Tianyin ElectromechanicalLtd (at least 2 which are potentially serious) , and understanding them should be part of your investment process.
We will like Changshu Tianyin ElectromechanicalLtd better if we see some big insider buys. While we wait, check out this free list of undervalued stocks (mostly small caps) with considerable, recent, insider buying.
Please note, the market returns quoted in this article reflect the market weighted average returns of stocks that currently trade on Chinese exchanges.
New: AI Stock Screener & Alerts
Our new AI Stock Screener scans the market every day to uncover opportunities.
• Dividend Powerhouses (3%+ Yield)
• Undervalued Small Caps with Insider Buying
• High growth Tech and AI Companies
Or build your own from over 50 metrics.
Have feedback on this article? Concerned about the content? Get in touch with us directly. Alternatively, email editorial-team (at) simplywallst.com.
This article by Simply Wall St is general in nature. We provide commentary based on historical data and analyst forecasts only using an unbiased methodology and our articles are not intended to be financial advice. It does not constitute a recommendation to buy or sell any stock, and does not take account of your objectives, or your financial situation. We aim to bring you long-term focused analysis driven by fundamental data. Note that our analysis may not factor in the latest price-sensitive company announcements or qualitative material. Simply Wall St has no position in any stocks mentioned.
About SZSE:300342
Changshu Tianyin ElectromechanicalLtd
Engages in the research and development, production, and sale of refrigerator compressor parts in China.
Flawless balance sheet slight.
