
Advertisement
- China
- /
- Electrical
- /
- SZSE:300286
Could The Market Be Wrong About Acrel Co.,Ltd. (SZSE:300286) Given Its Attractive Financial Prospects?

With its stock down 18% over the past three months, it is easy to disregard AcrelLtd (SZSE:300286). However, stock prices are usually driven by a company’s financial performance over the long term, which in this case looks quite promising. In this article, we decided to focus on AcrelLtd's ROE.
ROE or return on equity is a useful tool to assess how effectively a company can generate returns on the investment it received from its shareholders. In simpler terms, it measures the profitability of a company in relation to shareholder's equity.
Check out our latest analysis for AcrelLtd
How To Calculate Return On Equity?
Return on equity can be calculated by using the formula:
Return on Equity = Net Profit (from continuing operations) ÷ Shareholders' Equity
So, based on the above formula, the ROE for AcrelLtd is:
15% = CN¥201m ÷ CN¥1.3b (Based on the trailing twelve months to June 2024).
The 'return' refers to a company's earnings over the last year. One way to conceptualize this is that for each CN¥1 of shareholders' capital it has, the company made CN¥0.15 in profit.
What Is The Relationship Between ROE And Earnings Growth?
So far, we've learned that ROE is a measure of a company's profitability. We now need to evaluate how much profit the company reinvests or "retains" for future growth which then gives us an idea about the growth potential of the company. Assuming everything else remains unchanged, the higher the ROE and profit retention, the higher the growth rate of a company compared to companies that don't necessarily bear these characteristics.
AcrelLtd's Earnings Growth And 15% ROE
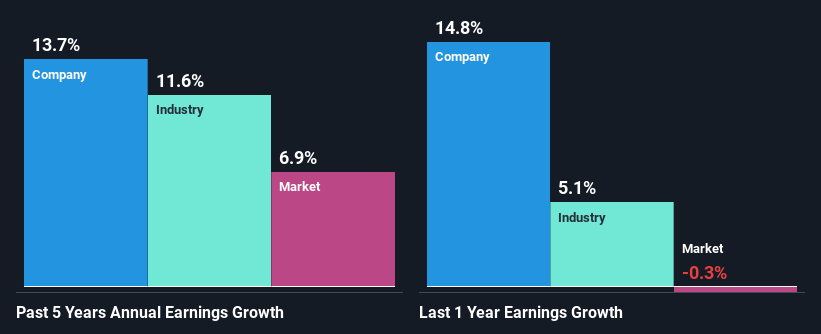
At first glance, AcrelLtd seems to have a decent ROE. On comparing with the average industry ROE of 6.9% the company's ROE looks pretty remarkable. This certainly adds some context to AcrelLtd's decent 14% net income growth seen over the past five years.
As a next step, we compared AcrelLtd's net income growth with the industry and found that the company has a similar growth figure when compared with the industry average growth rate of 12% in the same period.
The basis for attaching value to a company is, to a great extent, tied to its earnings growth. The investor should try to establish if the expected growth or decline in earnings, whichever the case may be, is priced in. Doing so will help them establish if the stock's future looks promising or ominous. One good indicator of expected earnings growth is the P/E ratio which determines the price the market is willing to pay for a stock based on its earnings prospects. So, you may want to check if AcrelLtd is trading on a high P/E or a low P/E, relative to its industry.
Is AcrelLtd Using Its Retained Earnings Effectively?
In AcrelLtd's case, its respectable earnings growth can probably be explained by its low three-year median payout ratio of 24% (or a retention ratio of 76%), which suggests that the company is investing most of its profits to grow its business.
Additionally, AcrelLtd has paid dividends over a period of at least ten years which means that the company is pretty serious about sharing its profits with shareholders.
Conclusion
On the whole, we feel that AcrelLtd's performance has been quite good. Particularly, we like that the company is reinvesting heavily into its business, and at a high rate of return. Unsurprisingly, this has led to an impressive earnings growth. With that said, the latest industry analyst forecasts reveal that the company's earnings are expected to accelerate. To know more about the company's future earnings growth forecasts take a look at this free report on analyst forecasts for the company to find out more.
New: Manage All Your Stock Portfolios in One Place
We've created the ultimate portfolio companion for stock investors, and it's free.
• Connect an unlimited number of Portfolios and see your total in one currency
• Be alerted to new Warning Signs or Risks via email or mobile
• Track the Fair Value of your stocks
Have feedback on this article? Concerned about the content? Get in touch with us directly. Alternatively, email editorial-team (at) simplywallst.com.
This article by Simply Wall St is general in nature. We provide commentary based on historical data and analyst forecasts only using an unbiased methodology and our articles are not intended to be financial advice. It does not constitute a recommendation to buy or sell any stock, and does not take account of your objectives, or your financial situation. We aim to bring you long-term focused analysis driven by fundamental data. Note that our analysis may not factor in the latest price-sensitive company announcements or qualitative material. Simply Wall St has no position in any stocks mentioned.
About SZSE:300286
AcrelLtd
Researches, develops, produces, and sells equipment and systems required for energy efficiency management of medium and low voltage for enterprise microgrids in China.
Flawless balance sheet with high growth potential and pays a dividend.
Market Insights


Advertisement
Community Narratives
For the Emperor: Why Games Workshop Could Be a Star Investment
Fair Value UK£160.00|0.4% overvalued
RO
Community Contributor
Securitas will boost margins with AI and tech-driven services
Fair Value SEK 260.91|44.5% undervalued
UN
Community Contributor
A Leader in EV Charging with Growth Potential
Fair Value €27.00|17.8% undervalued
TI
Community Contributor