
Advertisement
- China
- /
- Electrical
- /
- SZSE:300207
Capital Allocation Trends At Sunwoda ElectronicLtd (SZSE:300207) Aren't Ideal
What trends should we look for it we want to identify stocks that can multiply in value over the long term? One common approach is to try and find a company with returns on capital employed (ROCE) that are increasing, in conjunction with a growing amount of capital employed. This shows us that it's a compounding machine, able to continually reinvest its earnings back into the business and generate higher returns. However, after investigating Sunwoda ElectronicLtd (SZSE:300207), we don't think it's current trends fit the mold of a multi-bagger.
Understanding Return On Capital Employed (ROCE)
For those that aren't sure what ROCE is, it measures the amount of pre-tax profits a company can generate from the capital employed in its business. The formula for this calculation on Sunwoda ElectronicLtd is:
Return on Capital Employed = Earnings Before Interest and Tax (EBIT) ÷ (Total Assets - Current Liabilities)
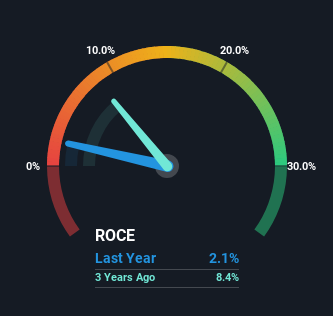
0.021 = CN¥998m ÷ (CN¥85b - CN¥39b) (Based on the trailing twelve months to September 2024).
Therefore, Sunwoda ElectronicLtd has an ROCE of 2.1%. Ultimately, that's a low return and it under-performs the Electrical industry average of 5.9%.
View our latest analysis for Sunwoda ElectronicLtd
Above you can see how the current ROCE for Sunwoda ElectronicLtd compares to its prior returns on capital, but there's only so much you can tell from the past. If you'd like to see what analysts are forecasting going forward, you should check out our free analyst report for Sunwoda ElectronicLtd .
The Trend Of ROCE
When we looked at the ROCE trend at Sunwoda ElectronicLtd, we didn't gain much confidence. Over the last five years, returns on capital have decreased to 2.1% from 18% five years ago. Meanwhile, the business is utilizing more capital but this hasn't moved the needle much in terms of sales in the past 12 months, so this could reflect longer term investments. It's worth keeping an eye on the company's earnings from here on to see if these investments do end up contributing to the bottom line.
On a related note, Sunwoda ElectronicLtd has decreased its current liabilities to 45% of total assets. So we could link some of this to the decrease in ROCE. What's more, this can reduce some aspects of risk to the business because now the company's suppliers or short-term creditors are funding less of its operations. Since the business is basically funding more of its operations with it's own money, you could argue this has made the business less efficient at generating ROCE. Keep in mind 45% is still pretty high, so those risks are still somewhat prevalent.
What We Can Learn From Sunwoda ElectronicLtd's ROCE
To conclude, we've found that Sunwoda ElectronicLtd is reinvesting in the business, but returns have been falling. Although the market must be expecting these trends to improve because the stock has gained 63% over the last five years. Ultimately, if the underlying trends persist, we wouldn't hold our breath on it being a multi-bagger going forward.
One more thing to note, we've identified 1 warning sign with Sunwoda ElectronicLtd and understanding it should be part of your investment process.
For those who like to invest in solid companies, check out this free list of companies with solid balance sheets and high returns on equity.
New: Manage All Your Stock Portfolios in One Place
We've created the ultimate portfolio companion for stock investors, and it's free.
• Connect an unlimited number of Portfolios and see your total in one currency
• Be alerted to new Warning Signs or Risks via email or mobile
• Track the Fair Value of your stocks
Have feedback on this article? Concerned about the content? Get in touch with us directly. Alternatively, email editorial-team (at) simplywallst.com.
This article by Simply Wall St is general in nature. We provide commentary based on historical data and analyst forecasts only using an unbiased methodology and our articles are not intended to be financial advice. It does not constitute a recommendation to buy or sell any stock, and does not take account of your objectives, or your financial situation. We aim to bring you long-term focused analysis driven by fundamental data. Note that our analysis may not factor in the latest price-sensitive company announcements or qualitative material. Simply Wall St has no position in any stocks mentioned.
About SZSE:300207
Sunwoda ElectronicLtd
Engages in the research and development, design, production, and sale of lithium-ion battery modules.
Undervalued with excellent balance sheet.
Similar Companies
Market Insights


Advertisement
Community Narratives
100% Patient Improvement in trial puts this $16M Biotech on the radar
Fair Value US$5.30|72.3% undervalued
JO
Community Contributor
Exxon Mobil's 17.5% Upside Promises Industry-Leading Returns in Energy Transition
Fair Value US$132.00|16.8% undervalued
HE
Community Contributor
NHC Analysis: Quality at a Good Price. A Golden Opportunity?
Fair Value US$179.80|35.5% undervalued
DA
Community Contributor
New Product Lines And Store Expansion Will Fuel Global Momentum
Fair Value US$270.82|37.9% undervalued
AN
Based on Analyst Price Targets