
Advertisement
- China
- /
- Semiconductors
- /
- SZSE:300125
It's Down 35% But Lingda Group Co., Ltd. (SZSE:300125) Could Be Riskier Than It Looks

To the annoyance of some shareholders, Lingda Group Co., Ltd. (SZSE:300125) shares are down a considerable 35% in the last month, which continues a horrid run for the company. For any long-term shareholders, the last month ends a year to forget by locking in a 65% share price decline.
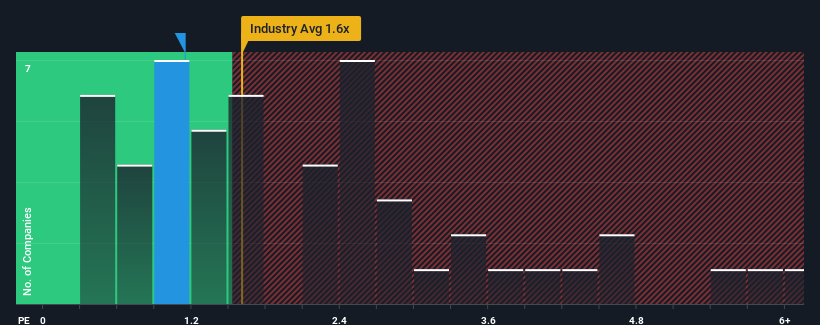
Although its price has dipped substantially, there still wouldn't be many who think Lingda Group's price-to-sales (or "P/S") ratio of 1.1x is worth a mention when the median P/S in China's Building industry is similar at about 1.6x. While this might not raise any eyebrows, if the P/S ratio is not justified investors could be missing out on a potential opportunity or ignoring looming disappointment.
See our latest analysis for Lingda Group
What Does Lingda Group's Recent Performance Look Like?
We'd have to say that with no tangible growth over the last year, Lingda Group's revenue has been unimpressive. One possibility is that the P/S is moderate because investors think this benign revenue growth rate might not be enough to outperform the broader industry in the near future. If not, then existing shareholders may be feeling hopeful about the future direction of the share price.
Want the full picture on earnings, revenue and cash flow for the company? Then our free report on Lingda Group will help you shine a light on its historical performance.How Is Lingda Group's Revenue Growth Trending?
In order to justify its P/S ratio, Lingda Group would need to produce growth that's similar to the industry.
Retrospectively, the last year delivered virtually the same number to the company's top line as the year before. The latest three year period has seen an incredible overall rise in revenue, in spite of this mediocre revenue growth of late. So while the company has done a great job in the past, it's somewhat concerning to see revenue growth decline so harshly.
Comparing that recent medium-term revenue trajectory with the industry's one-year growth forecast of 19% shows it's noticeably more attractive.
In light of this, it's curious that Lingda Group's P/S sits in line with the majority of other companies. It may be that most investors are not convinced the company can maintain its recent growth rates.
What We Can Learn From Lingda Group's P/S?
Lingda Group's plummeting stock price has brought its P/S back to a similar region as the rest of the industry. Typically, we'd caution against reading too much into price-to-sales ratios when settling on investment decisions, though it can reveal plenty about what other market participants think about the company.
We've established that Lingda Group currently trades on a lower than expected P/S since its recent three-year growth is higher than the wider industry forecast. When we see strong revenue with faster-than-industry growth, we can only assume potential risks are what might be placing pressure on the P/S ratio. It appears some are indeed anticipating revenue instability, because the persistence of these recent medium-term conditions would normally provide a boost to the share price.
You always need to take note of risks, for example - Lingda Group has 2 warning signs we think you should be aware of.
If these risks are making you reconsider your opinion on Lingda Group, explore our interactive list of high quality stocks to get an idea of what else is out there.
New: AI Stock Screener & Alerts
Our new AI Stock Screener scans the market every day to uncover opportunities.
• Dividend Powerhouses (3%+ Yield)
• Undervalued Small Caps with Insider Buying
• High growth Tech and AI Companies
Or build your own from over 50 metrics.
Have feedback on this article? Concerned about the content? Get in touch with us directly. Alternatively, email editorial-team (at) simplywallst.com.
This article by Simply Wall St is general in nature. We provide commentary based on historical data and analyst forecasts only using an unbiased methodology and our articles are not intended to be financial advice. It does not constitute a recommendation to buy or sell any stock, and does not take account of your objectives, or your financial situation. We aim to bring you long-term focused analysis driven by fundamental data. Note that our analysis may not factor in the latest price-sensitive company announcements or qualitative material. Simply Wall St has no position in any stocks mentioned.
About SZSE:300125
Lingda Group
Engages in the new energy industry development, ecological environment improvement, and energy saving activities in China.
Low with weak fundamentals.
Market Insights


Advertisement
Community Narratives
Alphabet: The Under-appreciated Compounder Hiding in Plain Sight
Fair Value US$282.83|31.8% undervalued
BL
Community Contributor
Planet Labs: At The Heart Of The Emerging New Space Boom
Fair Value US$11.31|44.7% undervalued
AN
Community Contributor
Exxon in Guyana 5 year forecast Low $135 to High $189
Fair Value US$189.00|40.9% undervalued
AG
Community Contributor