- China
- /
- Electrical
- /
- SZSE:300032
Jinlong Machinery & Electronic Co.,Ltd's (SZSE:300032) 29% Price Boost Is Out Of Tune With Revenues


Despite an already strong run, Jinlong Machinery & Electronic Co.,Ltd (SZSE:300032) shares have been powering on, with a gain of 29% in the last thirty days. Not all shareholders will be feeling jubilant, since the share price is still down a very disappointing 27% in the last twelve months.
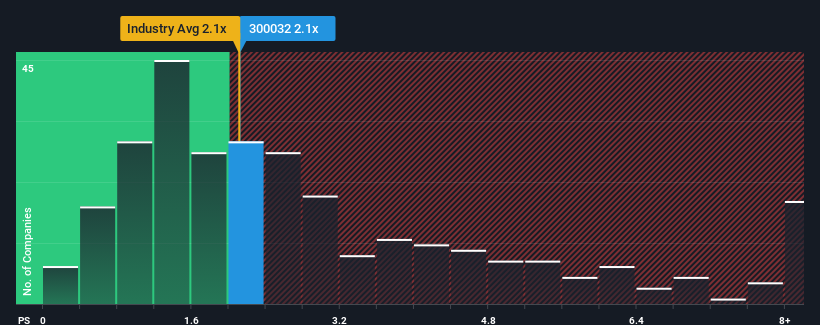
In spite of the firm bounce in price, there still wouldn't be many who think Jinlong Machinery & ElectronicLtd's price-to-sales (or "P/S") ratio of 2.1x is worth a mention when it essentially matches the median P/S in China's Electrical industry. Although, it's not wise to simply ignore the P/S without explanation as investors may be disregarding a distinct opportunity or a costly mistake.
Check out our latest analysis for Jinlong Machinery & ElectronicLtd
What Does Jinlong Machinery & ElectronicLtd's P/S Mean For Shareholders?
For instance, Jinlong Machinery & ElectronicLtd's receding revenue in recent times would have to be some food for thought. One possibility is that the P/S is moderate because investors think the company might still do enough to be in line with the broader industry in the near future. If you like the company, you'd at least be hoping this is the case so that you could potentially pick up some stock while it's not quite in favour.
We don't have analyst forecasts, but you can see how recent trends are setting up the company for the future by checking out our free report on Jinlong Machinery & ElectronicLtd's earnings, revenue and cash flow.Do Revenue Forecasts Match The P/S Ratio?
There's an inherent assumption that a company should be matching the industry for P/S ratios like Jinlong Machinery & ElectronicLtd's to be considered reasonable.
Retrospectively, the last year delivered a frustrating 57% decrease to the company's top line. This means it has also seen a slide in revenue over the longer-term as revenue is down 15% in total over the last three years. Accordingly, shareholders would have felt downbeat about the medium-term rates of revenue growth.
Comparing that to the industry, which is predicted to deliver 23% growth in the next 12 months, the company's downward momentum based on recent medium-term revenue results is a sobering picture.
In light of this, it's somewhat alarming that Jinlong Machinery & ElectronicLtd's P/S sits in line with the majority of other companies. It seems most investors are ignoring the recent poor growth rate and are hoping for a turnaround in the company's business prospects. Only the boldest would assume these prices are sustainable as a continuation of recent revenue trends is likely to weigh on the share price eventually.
What Does Jinlong Machinery & ElectronicLtd's P/S Mean For Investors?
Its shares have lifted substantially and now Jinlong Machinery & ElectronicLtd's P/S is back within range of the industry median. It's argued the price-to-sales ratio is an inferior measure of value within certain industries, but it can be a powerful business sentiment indicator.
We find it unexpected that Jinlong Machinery & ElectronicLtd trades at a P/S ratio that is comparable to the rest of the industry, despite experiencing declining revenues during the medium-term, while the industry as a whole is expected to grow. Even though it matches the industry, we're uncomfortable with the current P/S ratio, as this dismal revenue performance is unlikely to support a more positive sentiment for long. If recent medium-term revenue trends continue, it will place shareholders' investments at risk and potential investors in danger of paying an unnecessary premium.
There are also other vital risk factors to consider before investing and we've discovered 1 warning sign for Jinlong Machinery & ElectronicLtd that you should be aware of.
If companies with solid past earnings growth is up your alley, you may wish to see this free collection of other companies with strong earnings growth and low P/E ratios.
New: Manage All Your Stock Portfolios in One Place
We've created the ultimate portfolio companion for stock investors, and it's free.
• Connect an unlimited number of Portfolios and see your total in one currency
• Be alerted to new Warning Signs or Risks via email or mobile
• Track the Fair Value of your stocks
Have feedback on this article? Concerned about the content? Get in touch with us directly. Alternatively, email editorial-team (at) simplywallst.com.
This article by Simply Wall St is general in nature. We provide commentary based on historical data and analyst forecasts only using an unbiased methodology and our articles are not intended to be financial advice. It does not constitute a recommendation to buy or sell any stock, and does not take account of your objectives, or your financial situation. We aim to bring you long-term focused analysis driven by fundamental data. Note that our analysis may not factor in the latest price-sensitive company announcements or qualitative material. Simply Wall St has no position in any stocks mentioned.
About SZSE:300032
Jinlong Machinery & ElectronicLtd
Researches, produces, and sells motors in China and internationally.
Excellent balance sheet and overvalued.
Market Insights

Community Narratives


