

Global markets have recently experienced volatility, with U.S. stocks ending the week lower amid tariff uncertainties and mixed economic data. In such a fluctuating market landscape, investors often seek opportunities in various segments, including penny stocks, which though considered a somewhat outdated term, still represent an intriguing investment area. These smaller or newer companies can offer potential growth at lower price points when they are backed by strong financials and fundamentals.
Top 10 Penny Stocks
| Name | Share Price | Market Cap | Financial Health Rating |
| Bosideng International Holdings (SEHK:3998) | HK$3.87 | HK$44.43B | ★★★★★★ |
| DXN Holdings Bhd (KLSE:DXN) | MYR0.545 | MYR2.71B | ★★★★★★ |
| MGB Berhad (KLSE:MGB) | MYR0.705 | MYR417.12M | ★★★★★★ |
| Datasonic Group Berhad (KLSE:DSONIC) | MYR0.405 | MYR1.13B | ★★★★★★ |
| Begbies Traynor Group (AIM:BEG) | £0.93 | £148.21M | ★★★★★★ |
| Hil Industries Berhad (KLSE:HIL) | MYR0.85 | MYR282.15M | ★★★★★★ |
| Embark Early Education (ASX:EVO) | A$0.79 | A$144.95M | ★★★★☆☆ |
| Warpaint London (AIM:W7L) | £4.00 | £322.74M | ★★★★★★ |
| Lever Style (SEHK:1346) | HK$1.14 | HK$723.66M | ★★★★★★ |
| Helios Underwriting (AIM:HUW) | £2.26 | £161.24M | ★★★★★☆ |
Click here to see the full list of 5,703 stocks from our Penny Stocks screener.
Let's review some notable picks from our screened stocks.
China Fangda Group (SZSE:000055)
Simply Wall St Financial Health Rating: ★★★★☆☆
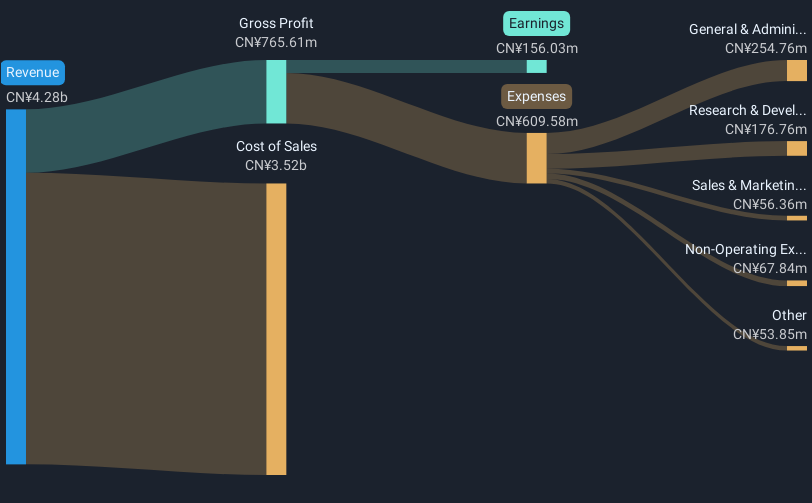
Overview: China Fangda Group Co., Ltd. manufactures and sells curtain wall materials both in China and internationally, with a market cap of CN¥3.46 billion.
Operations: The company has not reported any specific revenue segments.
Market Cap: CN¥3.46B
China Fangda Group, with a market cap of CN¥3.46 billion, presents a mixed picture for investors interested in smaller-cap stocks. The management and board are experienced, with average tenures of 4.7 and 6.3 years respectively, suggesting stability in leadership. Short-term assets exceed both short- and long-term liabilities, indicating solid liquidity management. However, the company faces challenges such as declining earnings over the past five years and lower profit margins compared to last year. While its price-to-earnings ratio is below the market average, debt levels have increased over time and operating cash flow does not adequately cover debt obligations.
- Click to explore a detailed breakdown of our findings in China Fangda Group's financial health report.
- Learn about China Fangda Group's historical performance here.
Jinlong Machinery & ElectronicLtd (SZSE:300032)
Simply Wall St Financial Health Rating: ★★★★★☆
Overview: Jinlong Machinery & Electronic Co., Ltd specializes in researching, producing, and selling motors both in China and internationally, with a market cap of CN¥3.86 billion.
Operations: The company has not reported any specific revenue segments.
Market Cap: CN¥3.86B
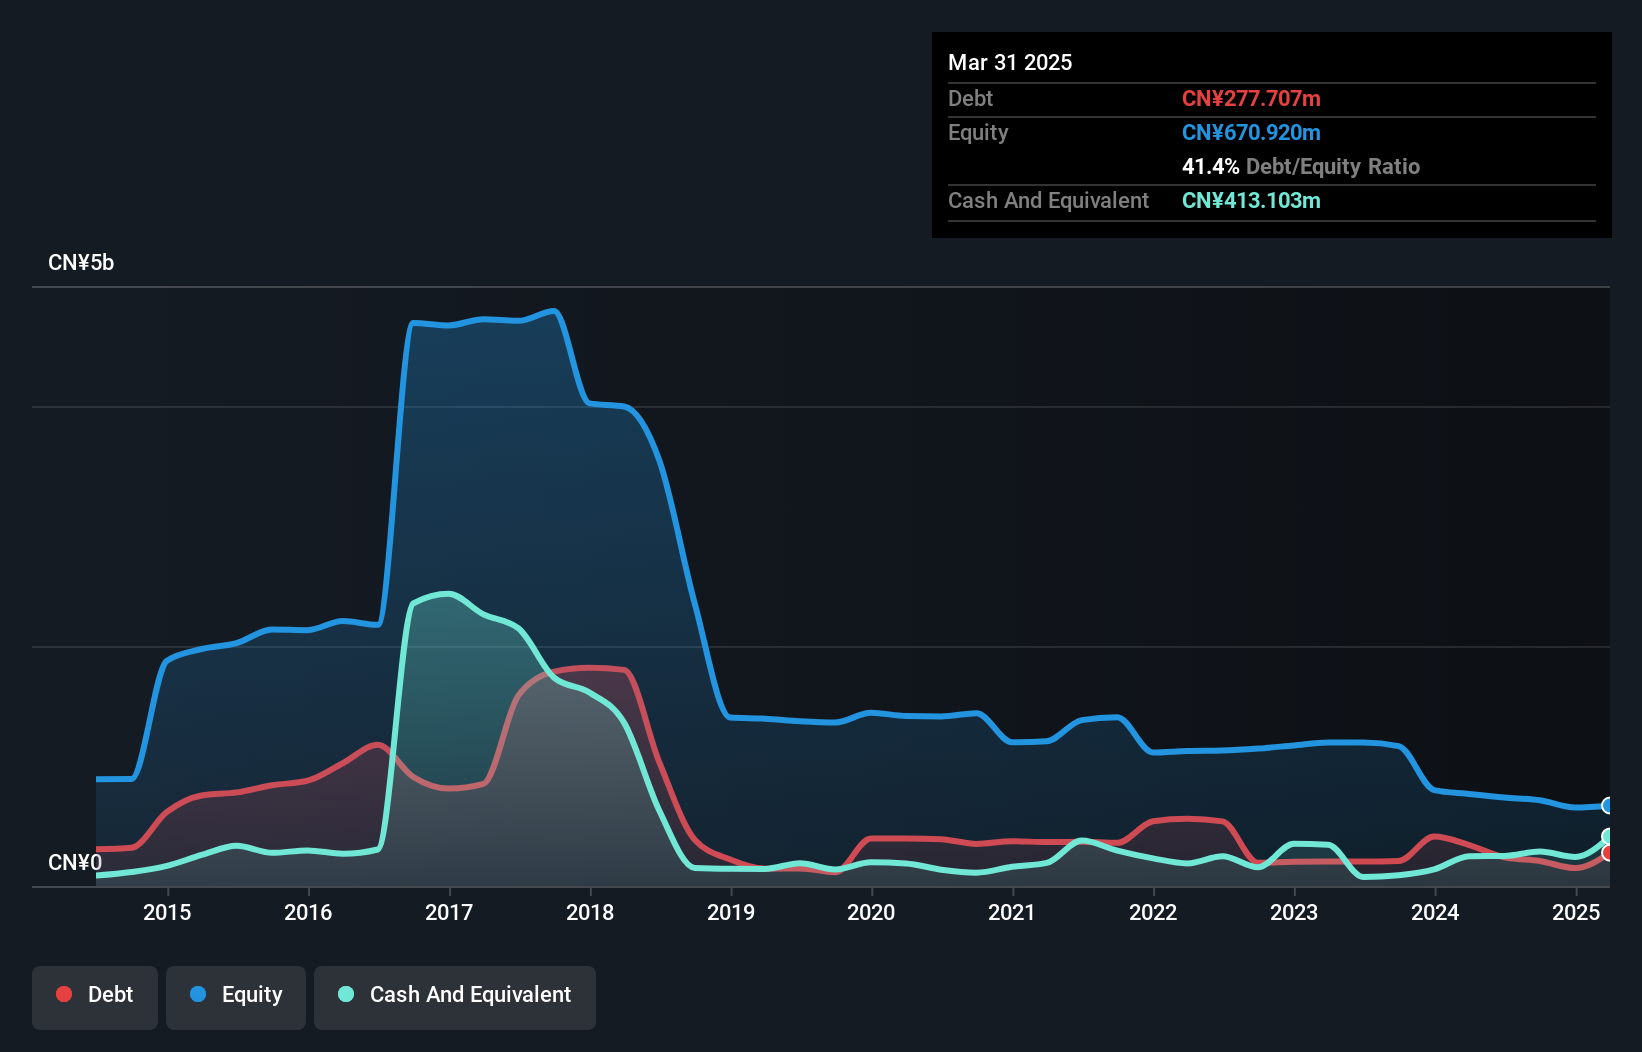
Jinlong Machinery & Electronic Ltd., with a market cap of CN¥3.86 billion, shows a complex investment profile. The company has ample short-term assets to cover both its short- and long-term liabilities, suggesting strong liquidity. Despite having more cash than debt, its debt-to-equity ratio has risen significantly over the past five years. The management team is relatively new with an average tenure of 1.3 years, while the board is more seasoned at 3.8 years on average. Jinlong remains unprofitable, with increasing losses over the past five years and a negative return on equity of -58.71%.
- Dive into the specifics of Jinlong Machinery & ElectronicLtd here with our thorough balance sheet health report.
- Evaluate Jinlong Machinery & ElectronicLtd's historical performance by accessing our past performance report.
Zhanjiang Guolian Aquatic Products (SZSE:300094)
Simply Wall St Financial Health Rating: ★★★★★☆
Overview: Zhanjiang Guolian Aquatic Products Co., Ltd. operates in the aquaculture industry, focusing on seafood processing and distribution, with a market cap of CN¥4.21 billion.
Operations: Zhanjiang Guolian Aquatic Products Co., Ltd. has not reported any specific revenue segments.
Market Cap: CN¥4.21B
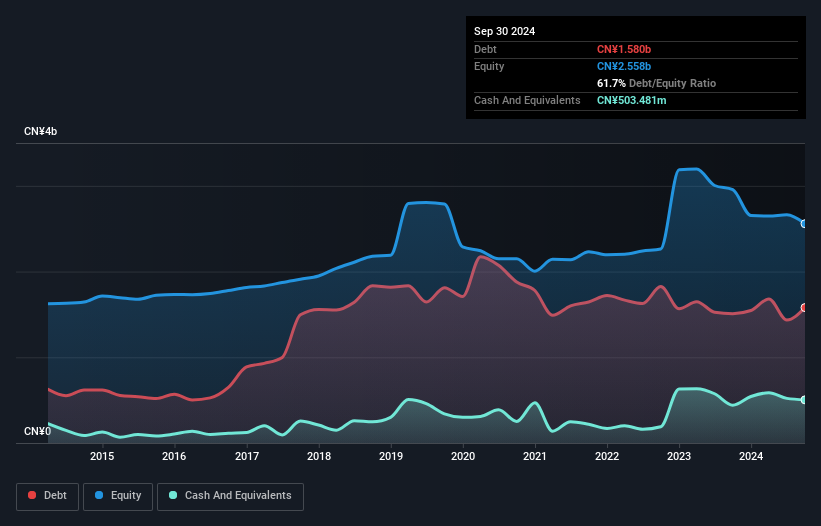
Zhanjiang Guolian Aquatic Products Co., Ltd., with a market cap of CN¥4.21 billion, presents an intriguing profile for penny stock investors. The company trades significantly below its estimated fair value and has reduced its debt-to-equity ratio over five years. Despite being unprofitable, it has narrowed losses annually by 2.1% and maintains a positive free cash flow with a runway exceeding three years. Short-term assets comfortably cover both short- and long-term liabilities, though the net debt to equity remains high at 42.1%. Recent removal from the S&P Global BMI Index might affect investor sentiment but doesn't alter fundamentals significantly.
- Jump into the full analysis health report here for a deeper understanding of Zhanjiang Guolian Aquatic Products.
- Assess Zhanjiang Guolian Aquatic Products' previous results with our detailed historical performance reports.
Make It Happen
- Jump into our full catalog of 5,703 Penny Stocks here.
- Are any of these part of your asset mix? Tap into the analytical power of Simply Wall St's portfolio to get a 360-degree view on how they're shaping up.
- Discover a world of investment opportunities with Simply Wall St's free app and access unparalleled stock analysis across all markets.
Want To Explore Some Alternatives?
- Explore high-performing small cap companies that haven't yet garnered significant analyst attention.
- Jump on the AI train with fast growing tech companies forging a new era of innovation.
- Find companies with promising cash flow potential yet trading below their fair value.
This article by Simply Wall St is general in nature. We provide commentary based on historical data and analyst forecasts only using an unbiased methodology and our articles are not intended to be financial advice. It does not constitute a recommendation to buy or sell any stock, and does not take account of your objectives, or your financial situation. We aim to bring you long-term focused analysis driven by fundamental data. Note that our analysis may not factor in the latest price-sensitive company announcements or qualitative material. Simply Wall St has no position in any stocks mentioned.
Valuation is complex, but we're here to simplify it.
Discover if Zhanjiang Guolian Aquatic Products might be undervalued or overvalued with our detailed analysis, featuring fair value estimates, potential risks, dividends, insider trades, and its financial condition.
Access Free AnalysisHave feedback on this article? Concerned about the content? Get in touch with us directly. Alternatively, email editorial-team@simplywallst.com
About SZSE:300094
Zhanjiang Guolian Aquatic Products
Zhanjiang Guolian Aquatic Products Co., Ltd.
Excellent balance sheet and good value.
Market Insights

Community Narratives


