Guangdong Dongpeng HoldingsLtd (SZSE:003012) Will Be Hoping To Turn Its Returns On Capital Around


If we want to find a stock that could multiply over the long term, what are the underlying trends we should look for? In a perfect world, we'd like to see a company investing more capital into its business and ideally the returns earned from that capital are also increasing. This shows us that it's a compounding machine, able to continually reinvest its earnings back into the business and generate higher returns. Although, when we looked at Guangdong Dongpeng HoldingsLtd (SZSE:003012), it didn't seem to tick all of these boxes.
Understanding Return On Capital Employed (ROCE)
If you haven't worked with ROCE before, it measures the 'return' (pre-tax profit) a company generates from capital employed in its business. The formula for this calculation on Guangdong Dongpeng HoldingsLtd is:
Return on Capital Employed = Earnings Before Interest and Tax (EBIT) ÷ (Total Assets - Current Liabilities)
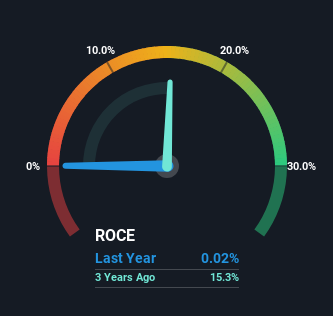
0.00024 = CN¥1.8m ÷ (CN¥13b - CN¥5.6b) (Based on the trailing twelve months to September 2022).
Thus, Guangdong Dongpeng HoldingsLtd has an ROCE of 0.02%. In absolute terms, that's a low return and it also under-performs the Building industry average of 6.4%.
View our latest analysis for Guangdong Dongpeng HoldingsLtd
In the above chart we have measured Guangdong Dongpeng HoldingsLtd's prior ROCE against its prior performance, but the future is arguably more important. If you'd like, you can check out the forecasts from the analysts covering Guangdong Dongpeng HoldingsLtd for free.
What Can We Tell From Guangdong Dongpeng HoldingsLtd's ROCE Trend?
When we looked at the ROCE trend at Guangdong Dongpeng HoldingsLtd, we didn't gain much confidence. Over the last five years, returns on capital have decreased to 0.02% from 29% five years ago. And considering revenue has dropped while employing more capital, we'd be cautious. If this were to continue, you might be looking at a company that is trying to reinvest for growth but is actually losing market share since sales haven't increased.
On a separate but related note, it's important to know that Guangdong Dongpeng HoldingsLtd has a current liabilities to total assets ratio of 43%, which we'd consider pretty high. This effectively means that suppliers (or short-term creditors) are funding a large portion of the business, so just be aware that this can introduce some elements of risk. Ideally we'd like to see this reduce as that would mean fewer obligations bearing risks.
In Conclusion...
We're a bit apprehensive about Guangdong Dongpeng HoldingsLtd because despite more capital being deployed in the business, returns on that capital and sales have both fallen. It should come as no surprise then that the stock has fallen 66% over the last three years, so it looks like investors are recognizing these changes. That being the case, unless the underlying trends revert to a more positive trajectory, we'd consider looking elsewhere.
On a separate note, we've found 1 warning sign for Guangdong Dongpeng HoldingsLtd you'll probably want to know about.
While Guangdong Dongpeng HoldingsLtd may not currently earn the highest returns, we've compiled a list of companies that currently earn more than 25% return on equity. Check out this free list here.
New: Manage All Your Stock Portfolios in One Place
We've created the ultimate portfolio companion for stock investors, and it's free.
• Connect an unlimited number of Portfolios and see your total in one currency
• Be alerted to new Warning Signs or Risks via email or mobile
• Track the Fair Value of your stocks
Have feedback on this article? Concerned about the content? Get in touch with us directly. Alternatively, email editorial-team (at) simplywallst.com.
This article by Simply Wall St is general in nature. We provide commentary based on historical data and analyst forecasts only using an unbiased methodology and our articles are not intended to be financial advice. It does not constitute a recommendation to buy or sell any stock, and does not take account of your objectives, or your financial situation. We aim to bring you long-term focused analysis driven by fundamental data. Note that our analysis may not factor in the latest price-sensitive company announcements or qualitative material. Simply Wall St has no position in any stocks mentioned.
About SZSE:003012
Guangdong Dongpeng HoldingsLtd
Engages in the research, development, production, and sale of building and sanitary ceramic products in China and internationally.
Flawless balance sheet second-rate dividend payer.
Market Insights

Community Narratives

