Capital Allocation Trends At Monalisa GroupLtd (SZSE:002918) Aren't Ideal


If you're looking for a multi-bagger, there's a few things to keep an eye out for. Ideally, a business will show two trends; firstly a growing return on capital employed (ROCE) and secondly, an increasing amount of capital employed. Basically this means that a company has profitable initiatives that it can continue to reinvest in, which is a trait of a compounding machine. However, after briefly looking over the numbers, we don't think Monalisa GroupLtd (SZSE:002918) has the makings of a multi-bagger going forward, but let's have a look at why that may be.
Understanding Return On Capital Employed (ROCE)
For those who don't know, ROCE is a measure of a company's yearly pre-tax profit (its return), relative to the capital employed in the business. To calculate this metric for Monalisa GroupLtd, this is the formula:
Return on Capital Employed = Earnings Before Interest and Tax (EBIT) ÷ (Total Assets - Current Liabilities)
0.071 = CN¥413m ÷ (CN¥9.5b - CN¥3.7b) (Based on the trailing twelve months to March 2024).
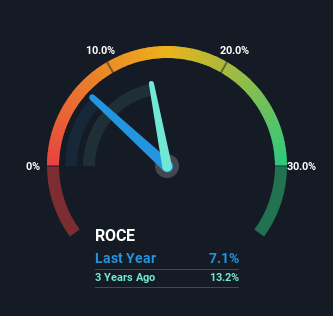
Therefore, Monalisa GroupLtd has an ROCE of 7.1%. On its own, that's a low figure but it's around the 7.7% average generated by the Building industry.
Check out our latest analysis for Monalisa GroupLtd
Above you can see how the current ROCE for Monalisa GroupLtd compares to its prior returns on capital, but there's only so much you can tell from the past. If you'd like, you can check out the forecasts from the analysts covering Monalisa GroupLtd for free.
So How Is Monalisa GroupLtd's ROCE Trending?
When we looked at the ROCE trend at Monalisa GroupLtd, we didn't gain much confidence. Around five years ago the returns on capital were 15%, but since then they've fallen to 7.1%. Given the business is employing more capital while revenue has slipped, this is a bit concerning. If this were to continue, you might be looking at a company that is trying to reinvest for growth but is actually losing market share since sales haven't increased.
The Key Takeaway
From the above analysis, we find it rather worrisome that returns on capital and sales for Monalisa GroupLtd have fallen, meanwhile the business is employing more capital than it was five years ago. In spite of that, the stock has delivered a 0.9% return to shareholders who held over the last five years. Regardless, we don't like the trends as they are and if they persist, we think you might find better investments elsewhere.
One more thing to note, we've identified 1 warning sign with Monalisa GroupLtd and understanding it should be part of your investment process.
If you want to search for solid companies with great earnings, check out this free list of companies with good balance sheets and impressive returns on equity.
New: Manage All Your Stock Portfolios in One Place
We've created the ultimate portfolio companion for stock investors, and it's free.
• Connect an unlimited number of Portfolios and see your total in one currency
• Be alerted to new Warning Signs or Risks via email or mobile
• Track the Fair Value of your stocks
Have feedback on this article? Concerned about the content? Get in touch with us directly. Alternatively, email editorial-team (at) simplywallst.com.
This article by Simply Wall St is general in nature. We provide commentary based on historical data and analyst forecasts only using an unbiased methodology and our articles are not intended to be financial advice. It does not constitute a recommendation to buy or sell any stock, and does not take account of your objectives, or your financial situation. We aim to bring you long-term focused analysis driven by fundamental data. Note that our analysis may not factor in the latest price-sensitive company announcements or qualitative material. Simply Wall St has no position in any stocks mentioned.
About SZSE:002918
Monalisa GroupLtd
Researches, develops, produces, and sells ceramic products in China.
Excellent balance sheet with moderate growth potential.
Market Insights

Community Narratives

