
Advertisement
- China
- /
- Construction
- /
- SZSE:002761
Zhejiang Construction Investment Group Co.,Ltd (SZSE:002761) Shares Fly 32% But Investors Aren't Buying For Growth

Zhejiang Construction Investment Group Co.,Ltd (SZSE:002761) shares have had a really impressive month, gaining 32% after a shaky period beforehand. Unfortunately, the gains of the last month did little to right the losses of the last year with the stock still down 36% over that time.
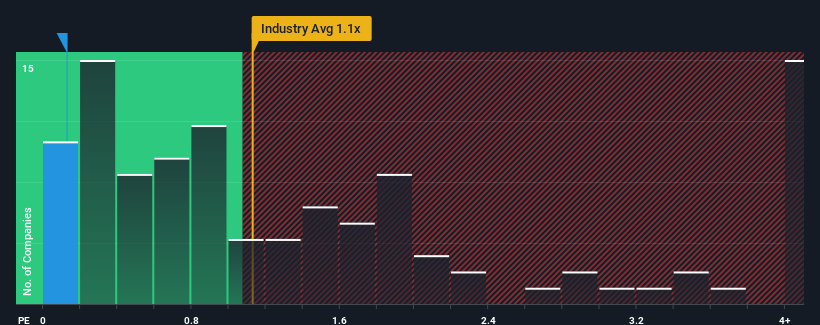
In spite of the firm bounce in price, considering around half the companies operating in China's Construction industry have price-to-sales ratios (or "P/S") above 1.1x, you may still consider Zhejiang Construction Investment GroupLtd as an solid investment opportunity with its 0.1x P/S ratio. Although, it's not wise to just take the P/S at face value as there may be an explanation why it's limited.
View our latest analysis for Zhejiang Construction Investment GroupLtd
What Does Zhejiang Construction Investment GroupLtd's Recent Performance Look Like?
For example, consider that Zhejiang Construction Investment GroupLtd's financial performance has been poor lately as its revenue has been in decline. It might be that many expect the disappointing revenue performance to continue or accelerate, which has repressed the P/S. However, if this doesn't eventuate then existing shareholders may be feeling optimistic about the future direction of the share price.
Although there are no analyst estimates available for Zhejiang Construction Investment GroupLtd, take a look at this free data-rich visualisation to see how the company stacks up on earnings, revenue and cash flow.How Is Zhejiang Construction Investment GroupLtd's Revenue Growth Trending?
The only time you'd be truly comfortable seeing a P/S as low as Zhejiang Construction Investment GroupLtd's is when the company's growth is on track to lag the industry.
Taking a look back first, the company's revenue growth last year wasn't something to get excited about as it posted a disappointing decline of 8.3%. Unfortunately, that's brought it right back to where it started three years ago with revenue growth being virtually non-existent overall during that time. Therefore, it's fair to say that revenue growth has been inconsistent recently for the company.
This is in contrast to the rest of the industry, which is expected to grow by 15% over the next year, materially higher than the company's recent medium-term annualised growth rates.
With this information, we can see why Zhejiang Construction Investment GroupLtd is trading at a P/S lower than the industry. Apparently many shareholders weren't comfortable holding on to something they believe will continue to trail the wider industry.
The Final Word
Despite Zhejiang Construction Investment GroupLtd's share price climbing recently, its P/S still lags most other companies. While the price-to-sales ratio shouldn't be the defining factor in whether you buy a stock or not, it's quite a capable barometer of revenue expectations.
In line with expectations, Zhejiang Construction Investment GroupLtd maintains its low P/S on the weakness of its recent three-year growth being lower than the wider industry forecast. Right now shareholders are accepting the low P/S as they concede future revenue probably won't provide any pleasant surprises. Unless the recent medium-term conditions improve, they will continue to form a barrier for the share price around these levels.
Don't forget that there may be other risks. For instance, we've identified 4 warning signs for Zhejiang Construction Investment GroupLtd (2 are concerning) you should be aware of.
If these risks are making you reconsider your opinion on Zhejiang Construction Investment GroupLtd, explore our interactive list of high quality stocks to get an idea of what else is out there.
Valuation is complex, but we're here to simplify it.
Discover if Zhejiang Construction Investment GroupLtd might be undervalued or overvalued with our detailed analysis, featuring fair value estimates, potential risks, dividends, insider trades, and its financial condition.
Access Free AnalysisHave feedback on this article? Concerned about the content? Get in touch with us directly. Alternatively, email editorial-team (at) simplywallst.com.
This article by Simply Wall St is general in nature. We provide commentary based on historical data and analyst forecasts only using an unbiased methodology and our articles are not intended to be financial advice. It does not constitute a recommendation to buy or sell any stock, and does not take account of your objectives, or your financial situation. We aim to bring you long-term focused analysis driven by fundamental data. Note that our analysis may not factor in the latest price-sensitive company announcements or qualitative material. Simply Wall St has no position in any stocks mentioned.
About SZSE:002761
Zhejiang Construction Investment GroupLtd
Engages in the construction business in China.
Low and slightly overvalued.
Market Insights

Advertisement
Community Narratives
Groundbreaking therapies that could change the treatment landscape for PTSD, fibromyalgia, MS & Alzheimer’s
Fair Value US$6.20|86.9% undervalued
CM
Community Contributor
DigitalOcean Will Grow 14% by Embracing AI with Paperspace Acquisition
Fair Value US$50.00|41.7% undervalued
NE
Community Contributor
Viant Technology: A Rising AdTech Challenger in the AI-Powered CTV Market
Fair Value US$38.61|63.2% undervalued
BL
Community Contributor
Volvo will Accelerate Forward into Electric and Autonomous Leadership in Five Years
Fair Value SEK 438.80|39.7% undervalued
UN
Community Contributor