Why Investors Shouldn't Be Surprised By Shenyang Yuanda Intellectual Industry Group Co.,Ltd's (SZSE:002689) 27% Share Price Plunge


Unfortunately for some shareholders, the Shenyang Yuanda Intellectual Industry Group Co.,Ltd (SZSE:002689) share price has dived 27% in the last thirty days, prolonging recent pain. The drop over the last 30 days has capped off a tough year for shareholders, with the share price down 48% in that time.
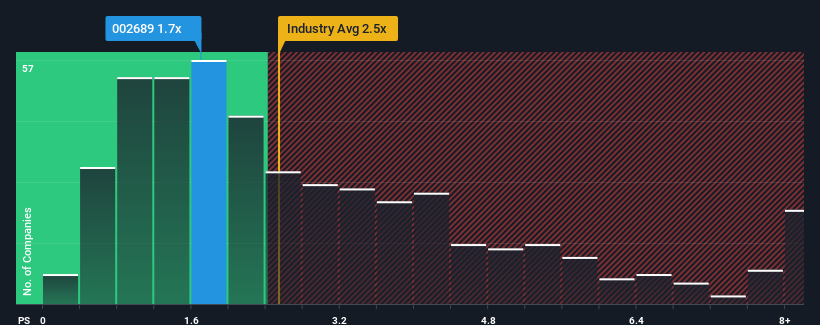
In spite of the heavy fall in price, Shenyang Yuanda Intellectual Industry GroupLtd's price-to-sales (or "P/S") ratio of 1.7x might still make it look like a buy right now compared to the Machinery industry in China, where around half of the companies have P/S ratios above 2.5x and even P/S above 5x are quite common. Nonetheless, we'd need to dig a little deeper to determine if there is a rational basis for the reduced P/S.
Check out our latest analysis for Shenyang Yuanda Intellectual Industry GroupLtd
What Does Shenyang Yuanda Intellectual Industry GroupLtd's P/S Mean For Shareholders?
Recent times have been quite advantageous for Shenyang Yuanda Intellectual Industry GroupLtd as its revenue has been rising very briskly. Perhaps the market is expecting future revenue performance to dwindle, which has kept the P/S suppressed. If that doesn't eventuate, then existing shareholders have reason to be quite optimistic about the future direction of the share price.
Want the full picture on earnings, revenue and cash flow for the company? Then our free report on Shenyang Yuanda Intellectual Industry GroupLtd will help you shine a light on its historical performance.Do Revenue Forecasts Match The Low P/S Ratio?
Shenyang Yuanda Intellectual Industry GroupLtd's P/S ratio would be typical for a company that's only expected to deliver limited growth, and importantly, perform worse than the industry.
Taking a look back first, we see that the company grew revenue by an impressive 32% last year. The latest three year period has also seen an excellent 46% overall rise in revenue, aided by its short-term performance. Accordingly, shareholders would have definitely welcomed those medium-term rates of revenue growth.
Comparing that to the industry, which is predicted to deliver 24% growth in the next 12 months, the company's momentum is weaker, based on recent medium-term annualised revenue results.
With this in consideration, it's easy to understand why Shenyang Yuanda Intellectual Industry GroupLtd's P/S falls short of the mark set by its industry peers. It seems most investors are expecting to see the recent limited growth rates continue into the future and are only willing to pay a reduced amount for the stock.
The Bottom Line On Shenyang Yuanda Intellectual Industry GroupLtd's P/S
Shenyang Yuanda Intellectual Industry GroupLtd's recently weak share price has pulled its P/S back below other Machinery companies. Generally, our preference is to limit the use of the price-to-sales ratio to establishing what the market thinks about the overall health of a company.
In line with expectations, Shenyang Yuanda Intellectual Industry GroupLtd maintains its low P/S on the weakness of its recent three-year growth being lower than the wider industry forecast. Right now shareholders are accepting the low P/S as they concede future revenue probably won't provide any pleasant surprises. Unless the recent medium-term conditions improve, they will continue to form a barrier for the share price around these levels.
We don't want to rain on the parade too much, but we did also find 1 warning sign for Shenyang Yuanda Intellectual Industry GroupLtd that you need to be mindful of.
If companies with solid past earnings growth is up your alley, you may wish to see this free collection of other companies with strong earnings growth and low P/E ratios.
New: Manage All Your Stock Portfolios in One Place
We've created the ultimate portfolio companion for stock investors, and it's free.
• Connect an unlimited number of Portfolios and see your total in one currency
• Be alerted to new Warning Signs or Risks via email or mobile
• Track the Fair Value of your stocks
Have feedback on this article? Concerned about the content? Get in touch with us directly. Alternatively, email editorial-team (at) simplywallst.com.
This article by Simply Wall St is general in nature. We provide commentary based on historical data and analyst forecasts only using an unbiased methodology and our articles are not intended to be financial advice. It does not constitute a recommendation to buy or sell any stock, and does not take account of your objectives, or your financial situation. We aim to bring you long-term focused analysis driven by fundamental data. Note that our analysis may not factor in the latest price-sensitive company announcements or qualitative material. Simply Wall St has no position in any stocks mentioned.
About SZSE:002689
Shenyang Yuanda Intellectual Industry GroupLtd
Researches, develops, manufactures, installs, and sells elevators in China and internationally.
Flawless balance sheet with proven track record.
Market Insights

Community Narratives

