
Advertisement
- China
- /
- Construction
- /
- SZSE:002551
Risks Still Elevated At These Prices As Shenzhen Glory Medical Co.,Ltd. (SZSE:002551) Shares Dive 29%

Shenzhen Glory Medical Co.,Ltd. (SZSE:002551) shareholders won't be pleased to see that the share price has had a very rough month, dropping 29% and undoing the prior period's positive performance. Instead of being rewarded, shareholders who have already held through the last twelve months are now sitting on a 39% share price drop.
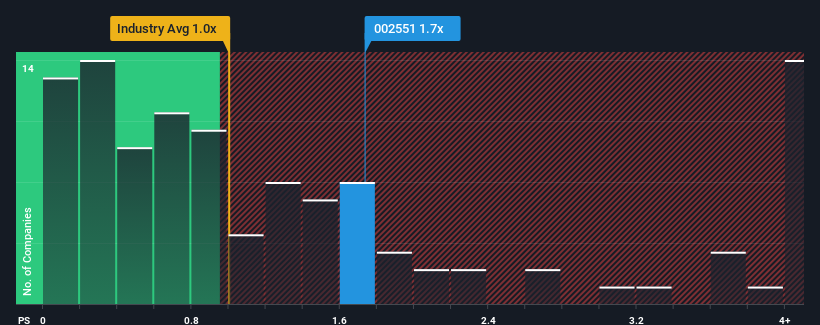
In spite of the heavy fall in price, you could still be forgiven for thinking Shenzhen Glory MedicalLtd is a stock not worth researching with a price-to-sales ratios (or "P/S") of 1.7x, considering almost half the companies in China's Construction industry have P/S ratios below 1x. Although, it's not wise to just take the P/S at face value as there may be an explanation why it's as high as it is.
Check out our latest analysis for Shenzhen Glory MedicalLtd
How Shenzhen Glory MedicalLtd Has Been Performing
Revenue has risen at a steady rate over the last year for Shenzhen Glory MedicalLtd, which is generally not a bad outcome. It might be that many expect the reasonable revenue performance to beat most other companies over the coming period, which has increased investors’ willingness to pay up for the stock. However, if this isn't the case, investors might get caught out paying too much for the stock.
Although there are no analyst estimates available for Shenzhen Glory MedicalLtd, take a look at this free data-rich visualisation to see how the company stacks up on earnings, revenue and cash flow.Do Revenue Forecasts Match The High P/S Ratio?
In order to justify its P/S ratio, Shenzhen Glory MedicalLtd would need to produce impressive growth in excess of the industry.
If we review the last year of revenue growth, the company posted a worthy increase of 5.3%. However, this wasn't enough as the latest three year period has seen an unpleasant 53% overall drop in revenue. Therefore, it's fair to say the revenue growth recently has been undesirable for the company.
Comparing that to the industry, which is predicted to deliver 15% growth in the next 12 months, the company's downward momentum based on recent medium-term revenue results is a sobering picture.
With this information, we find it concerning that Shenzhen Glory MedicalLtd is trading at a P/S higher than the industry. Apparently many investors in the company are way more bullish than recent times would indicate and aren't willing to let go of their stock at any price. There's a very good chance existing shareholders are setting themselves up for future disappointment if the P/S falls to levels more in line with the recent negative growth rates.
The Key Takeaway
Shenzhen Glory MedicalLtd's P/S remain high even after its stock plunged. It's argued the price-to-sales ratio is an inferior measure of value within certain industries, but it can be a powerful business sentiment indicator.
We've established that Shenzhen Glory MedicalLtd currently trades on a much higher than expected P/S since its recent revenues have been in decline over the medium-term. With a revenue decline on investors' minds, the likelihood of a souring sentiment is quite high which could send the P/S back in line with what we'd expect. Unless the recent medium-term conditions improve markedly, investors will have a hard time accepting the share price as fair value.
Having said that, be aware Shenzhen Glory MedicalLtd is showing 1 warning sign in our investment analysis, you should know about.
If companies with solid past earnings growth is up your alley, you may wish to see this free collection of other companies with strong earnings growth and low P/E ratios.
New: Manage All Your Stock Portfolios in One Place
We've created the ultimate portfolio companion for stock investors, and it's free.
• Connect an unlimited number of Portfolios and see your total in one currency
• Be alerted to new Warning Signs or Risks via email or mobile
• Track the Fair Value of your stocks
Have feedback on this article? Concerned about the content? Get in touch with us directly. Alternatively, email editorial-team (at) simplywallst.com.
This article by Simply Wall St is general in nature. We provide commentary based on historical data and analyst forecasts only using an unbiased methodology and our articles are not intended to be financial advice. It does not constitute a recommendation to buy or sell any stock, and does not take account of your objectives, or your financial situation. We aim to bring you long-term focused analysis driven by fundamental data. Note that our analysis may not factor in the latest price-sensitive company announcements or qualitative material. Simply Wall St has no position in any stocks mentioned.
About SZSE:002551
Shenzhen Glory MedicalLtd
Provides hospital construction and medical system integrated solutions in China and internationally.
Excellent balance sheet and overvalued.
Market Insights

Advertisement
Community Narratives
Groundbreaking therapies that could change the treatment landscape for PTSD, fibromyalgia, MS & Alzheimer’s
Fair Value US$6.20|86.9% undervalued
CM
Community Contributor
DigitalOcean Will Grow 14% by Embracing AI with Paperspace Acquisition
Fair Value US$50.00|42.8% undervalued
NE
Community Contributor
Viant Technology: A Rising AdTech Challenger in the AI-Powered CTV Market
Fair Value US$38.61|66.0% undervalued
BL
Community Contributor
Volvo will Accelerate Forward into Electric and Autonomous Leadership in Five Years
Fair Value SEK 438.80|40.8% undervalued
UN
Community Contributor