Shandong Tengda Fasten Tech. Co., Ltd.'s (SZSE:001379) Stock On An Uptrend: Could Fundamentals Be Driving The Momentum?


Most readers would already be aware that Shandong Tengda Fasten Tech's (SZSE:001379) stock increased significantly by 47% over the past three months. Given that stock prices are usually aligned with a company's financial performance in the long-term, we decided to study its financial indicators more closely to see if they had a hand to play in the recent price move. In this article, we decided to focus on Shandong Tengda Fasten Tech's ROE.
Return on Equity or ROE is a test of how effectively a company is growing its value and managing investors’ money. Simply put, it is used to assess the profitability of a company in relation to its equity capital.
See our latest analysis for Shandong Tengda Fasten Tech
How To Calculate Return On Equity?
ROE can be calculated by using the formula:
Return on Equity = Net Profit (from continuing operations) ÷ Shareholders' Equity
So, based on the above formula, the ROE for Shandong Tengda Fasten Tech is:
5.6% = CN¥80m ÷ CN¥1.4b (Based on the trailing twelve months to June 2024).
The 'return' is the yearly profit. Another way to think of that is that for every CN¥1 worth of equity, the company was able to earn CN¥0.06 in profit.
What Has ROE Got To Do With Earnings Growth?
Thus far, we have learned that ROE measures how efficiently a company is generating its profits. We now need to evaluate how much profit the company reinvests or "retains" for future growth which then gives us an idea about the growth potential of the company. Assuming everything else remains unchanged, the higher the ROE and profit retention, the higher the growth rate of a company compared to companies that don't necessarily bear these characteristics.
Shandong Tengda Fasten Tech's Earnings Growth And 5.6% ROE
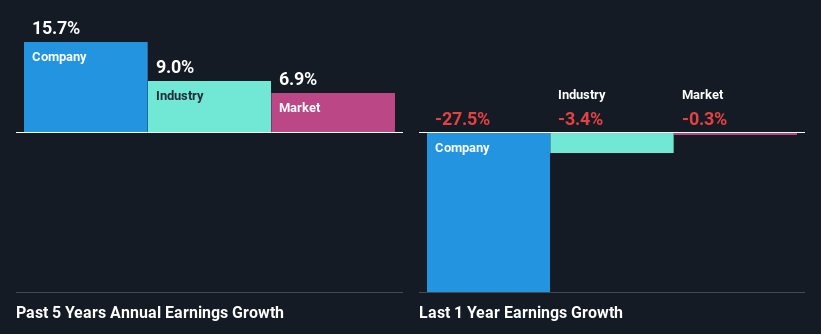
On the face of it, Shandong Tengda Fasten Tech's ROE is not much to talk about. However, given that the company's ROE is similar to the average industry ROE of 6.9%, we may spare it some thought. Even so, Shandong Tengda Fasten Tech has shown a fairly decent growth in its net income which grew at a rate of 16%. Considering the moderately low ROE, it is quite possible that there might be some other aspects that are positively influencing the company's earnings growth. Such as - high earnings retention or an efficient management in place.
We then compared Shandong Tengda Fasten Tech's net income growth with the industry and we're pleased to see that the company's growth figure is higher when compared with the industry which has a growth rate of 9.0% in the same 5-year period.
Earnings growth is a huge factor in stock valuation. The investor should try to establish if the expected growth or decline in earnings, whichever the case may be, is priced in. This then helps them determine if the stock is placed for a bright or bleak future. Is Shandong Tengda Fasten Tech fairly valued compared to other companies? These 3 valuation measures might help you decide.
Is Shandong Tengda Fasten Tech Efficiently Re-investing Its Profits?
Shandong Tengda Fasten Tech has a three-year median payout ratio of 28%, which implies that it retains the remaining 72% of its profits. This suggests that its dividend is well covered, and given the decent growth seen by the company, it looks like management is reinvesting its earnings efficiently.
Summary
On the whole, we do feel that Shandong Tengda Fasten Tech has some positive attributes. With a high rate of reinvestment, albeit at a low ROE, the company has managed to see a considerable growth in its earnings. While we won't completely dismiss the company, what we would do, is try to ascertain how risky the business is to make a more informed decision around the company. To know the 2 risks we have identified for Shandong Tengda Fasten Tech visit our risks dashboard for free.
New: Manage All Your Stock Portfolios in One Place
We've created the ultimate portfolio companion for stock investors, and it's free.
• Connect an unlimited number of Portfolios and see your total in one currency
• Be alerted to new Warning Signs or Risks via email or mobile
• Track the Fair Value of your stocks
Have feedback on this article? Concerned about the content? Get in touch with us directly. Alternatively, email editorial-team (at) simplywallst.com.
This article by Simply Wall St is general in nature. We provide commentary based on historical data and analyst forecasts only using an unbiased methodology and our articles are not intended to be financial advice. It does not constitute a recommendation to buy or sell any stock, and does not take account of your objectives, or your financial situation. We aim to bring you long-term focused analysis driven by fundamental data. Note that our analysis may not factor in the latest price-sensitive company announcements or qualitative material. Simply Wall St has no position in any stocks mentioned.
About SZSE:001379
Shandong Tengda Fasten Tech
Engages in the research and development, production, and sale of stainless-steel fasteners in China.
Adequate balance sheet and overvalued.

