KAMA Co.,Ltd. (SHSE:900953) Looks Inexpensive After Falling 32% But Perhaps Not Attractive Enough


KAMA Co.,Ltd. (SHSE:900953) shareholders that were waiting for something to happen have been dealt a blow with a 32% share price drop in the last month. Instead of being rewarded, shareholders who have already held through the last twelve months are now sitting on a 48% share price drop.
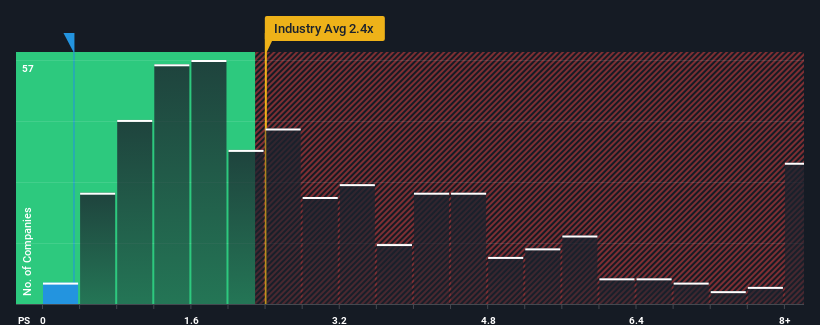
Following the heavy fall in price, KAMALtd may be sending very bullish signals at the moment with its price-to-sales (or "P/S") ratio of 0.3x, since almost half of all companies in the Machinery industry in China have P/S ratios greater than 2.4x and even P/S higher than 5x are not unusual. However, the P/S might be quite low for a reason and it requires further investigation to determine if it's justified.
View our latest analysis for KAMALtd
How Has KAMALtd Performed Recently?
For example, consider that KAMALtd's financial performance has been pretty ordinary lately as revenue growth is non-existent. It might be that many expect the uninspiring revenue performance to worsen, which has repressed the P/S. If not, then existing shareholders may be feeling optimistic about the future direction of the share price.
We don't have analyst forecasts, but you can see how recent trends are setting up the company for the future by checking out our free report on KAMALtd's earnings, revenue and cash flow.Is There Any Revenue Growth Forecasted For KAMALtd?
There's an inherent assumption that a company should far underperform the industry for P/S ratios like KAMALtd's to be considered reasonable.
Taking a look back first, we see that there was hardly any revenue growth to speak of for the company over the past year. The lack of growth did nothing to help the company's aggregate three-year performance, which is an unsavory 24% drop in revenue. Therefore, it's fair to say the revenue growth recently has been undesirable for the company.
Comparing that to the industry, which is predicted to deliver 24% growth in the next 12 months, the company's downward momentum based on recent medium-term revenue results is a sobering picture.
With this in mind, we understand why KAMALtd's P/S is lower than most of its industry peers. Nonetheless, there's no guarantee the P/S has reached a floor yet with revenue going in reverse. Even just maintaining these prices could be difficult to achieve as recent revenue trends are already weighing down the shares.
What We Can Learn From KAMALtd's P/S?
Having almost fallen off a cliff, KAMALtd's share price has pulled its P/S way down as well. Using the price-to-sales ratio alone to determine if you should sell your stock isn't sensible, however it can be a practical guide to the company's future prospects.
Our examination of KAMALtd confirms that the company's shrinking revenue over the past medium-term is a key factor in its low price-to-sales ratio, given the industry is projected to grow. Right now shareholders are accepting the low P/S as they concede future revenue probably won't provide any pleasant surprises either. Given the current circumstances, it seems unlikely that the share price will experience any significant movement in either direction in the near future if recent medium-term revenue trends persist.
And what about other risks? Every company has them, and we've spotted 1 warning sign for KAMALtd you should know about.
Of course, profitable companies with a history of great earnings growth are generally safer bets. So you may wish to see this free collection of other companies that have reasonable P/E ratios and have grown earnings strongly.
Valuation is complex, but we're here to simplify it.
Discover if KAMALtd might be undervalued or overvalued with our detailed analysis, featuring fair value estimates, potential risks, dividends, insider trades, and its financial condition.
Access Free AnalysisHave feedback on this article? Concerned about the content? Get in touch with us directly. Alternatively, email editorial-team (at) simplywallst.com.
This article by Simply Wall St is general in nature. We provide commentary based on historical data and analyst forecasts only using an unbiased methodology and our articles are not intended to be financial advice. It does not constitute a recommendation to buy or sell any stock, and does not take account of your objectives, or your financial situation. We aim to bring you long-term focused analysis driven by fundamental data. Note that our analysis may not factor in the latest price-sensitive company announcements or qualitative material. Simply Wall St has no position in any stocks mentioned.
About SHSE:900953
KAMALtd
Manufactures and sells trucks, micro and light trucks, engineering trucks, special cars, electric vehicles, pickup trucks, and internal combustion engines in China.
Adequate balance sheet low.

