Stock Analysis
Are Freewon China Co.,Ltd.'s (SHSE:688678) Mixed Financials Driving The Negative Sentiment?


Freewon ChinaLtd (SHSE:688678) has had a rough month with its share price down 17%. We, however decided to study the company's financials to determine if they have got anything to do with the price decline. Long-term fundamentals are usually what drive market outcomes, so it's worth paying close attention. In this article, we decided to focus on Freewon ChinaLtd's ROE.
Return on equity or ROE is an important factor to be considered by a shareholder because it tells them how effectively their capital is being reinvested. In short, ROE shows the profit each dollar generates with respect to its shareholder investments.
Check out our latest analysis for Freewon ChinaLtd
How To Calculate Return On Equity?
The formula for ROE is:
Return on Equity = Net Profit (from continuing operations) ÷ Shareholders' Equity
So, based on the above formula, the ROE for Freewon ChinaLtd is:
6.8% = CN¥112m ÷ CN¥1.6b (Based on the trailing twelve months to March 2024).
The 'return' is the profit over the last twelve months. One way to conceptualize this is that for each CN¥1 of shareholders' capital it has, the company made CN¥0.07 in profit.
Why Is ROE Important For Earnings Growth?
So far, we've learned that ROE is a measure of a company's profitability. Depending on how much of these profits the company reinvests or "retains", and how effectively it does so, we are then able to assess a company’s earnings growth potential. Assuming everything else remains unchanged, the higher the ROE and profit retention, the higher the growth rate of a company compared to companies that don't necessarily bear these characteristics.
Freewon ChinaLtd's Earnings Growth And 6.8% ROE
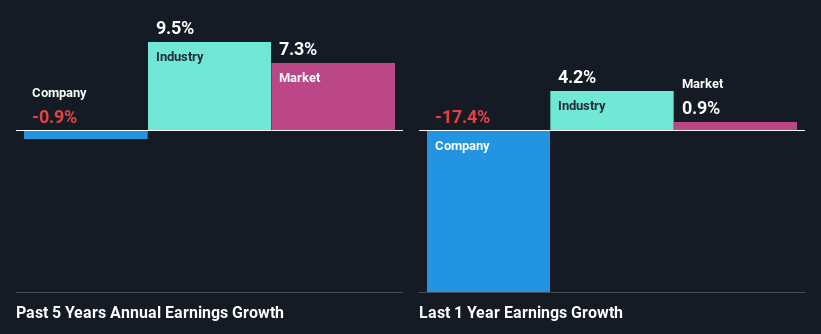
On the face of it, Freewon ChinaLtd's ROE is not much to talk about. However, its ROE is similar to the industry average of 6.9%, so we won't completely dismiss the company. Having said that, Freewon ChinaLtd's net income growth over the past five years is more or less flat. Remember, the company's ROE is not particularly great to begin with. So that could also be one of the reasons behind the company's flat growth in earnings.
As a next step, we compared Freewon ChinaLtd's net income growth with the industry and discovered that the industry saw an average growth of 9.5% in the same period.
Earnings growth is a huge factor in stock valuation. It’s important for an investor to know whether the market has priced in the company's expected earnings growth (or decline). Doing so will help them establish if the stock's future looks promising or ominous. If you're wondering about Freewon ChinaLtd's's valuation, check out this gauge of its price-to-earnings ratio, as compared to its industry.
Is Freewon ChinaLtd Making Efficient Use Of Its Profits?
Despite having a normal three-year median payout ratio of 39% (implying that the company keeps 61% of its income) over the last three years, Freewon ChinaLtd has seen a negligible amount of growth in earnings as we saw above. So there might be other factors at play here which could potentially be hampering growth. For example, the business has faced some headwinds.
Moreover, Freewon ChinaLtd has been paying dividends for three years, which is a considerable amount of time, suggesting that management must have perceived that the shareholders prefer dividends over earnings growth.
Summary
In total, we're a bit ambivalent about Freewon ChinaLtd's performance. While the company does have a high rate of profit retention, its low rate of return is probably hampering its earnings growth. Having said that, looking at current analyst estimates, we found that the company's earnings growth rate is expected to see a huge improvement. To know more about the company's future earnings growth forecasts take a look at this free report on analyst forecasts for the company to find out more.
New: AI Stock Screener & Alerts
Our new AI Stock Screener scans the market every day to uncover opportunities.
• Dividend Powerhouses (3%+ Yield)
• Undervalued Small Caps with Insider Buying
• High growth Tech and AI Companies
Or build your own from over 50 metrics.
Have feedback on this article? Concerned about the content? Get in touch with us directly. Alternatively, email editorial-team (at) simplywallst.com.
This article by Simply Wall St is general in nature. We provide commentary based on historical data and analyst forecasts only using an unbiased methodology and our articles are not intended to be financial advice. It does not constitute a recommendation to buy or sell any stock, and does not take account of your objectives, or your financial situation. We aim to bring you long-term focused analysis driven by fundamental data. Note that our analysis may not factor in the latest price-sensitive company announcements or qualitative material. Simply Wall St has no position in any stocks mentioned.
Have feedback on this article? Concerned about the content? Get in touch with us directly. Alternatively, email editorial-team@simplywallst.com
About SHSE:688678
Freewon ChinaLtd
Engages in the research and development, manufacture, and sale of precision metal parts.
High growth potential with adequate balance sheet.
