
Advertisement
Zhe Jiang Headman Machinery Co.,Ltd.'s (SHSE:688577) 31% Price Boost Is Out Of Tune With Revenues

Zhe Jiang Headman Machinery Co.,Ltd. (SHSE:688577) shareholders would be excited to see that the share price has had a great month, posting a 31% gain and recovering from prior weakness. Looking back a bit further, it's encouraging to see the stock is up 47% in the last year.
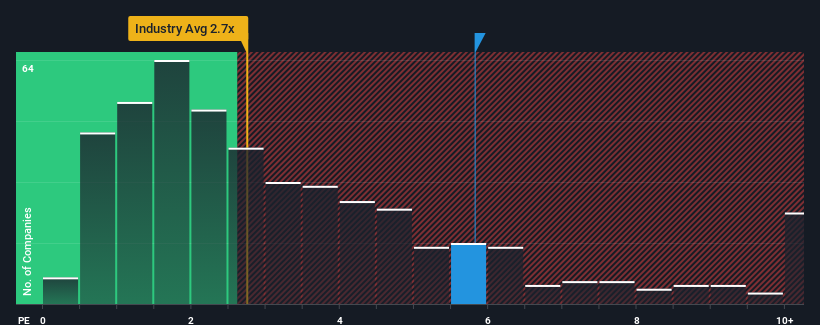
Following the firm bounce in price, given around half the companies in China's Machinery industry have price-to-sales ratios (or "P/S") below 2.7x, you may consider Zhe Jiang Headman MachineryLtd as a stock to avoid entirely with its 5.8x P/S ratio. However, the P/S might be quite high for a reason and it requires further investigation to determine if it's justified.
View our latest analysis for Zhe Jiang Headman MachineryLtd
What Does Zhe Jiang Headman MachineryLtd's Recent Performance Look Like?
Revenue has risen at a steady rate over the last year for Zhe Jiang Headman MachineryLtd, which is generally not a bad outcome. One possibility is that the P/S ratio is high because investors think this good revenue growth will be enough to outperform the broader industry in the near future. If not, then existing shareholders may be a little nervous about the viability of the share price.
Although there are no analyst estimates available for Zhe Jiang Headman MachineryLtd, take a look at this free data-rich visualisation to see how the company stacks up on earnings, revenue and cash flow.What Are Revenue Growth Metrics Telling Us About The High P/S?
In order to justify its P/S ratio, Zhe Jiang Headman MachineryLtd would need to produce outstanding growth that's well in excess of the industry.
Taking a look back first, we see that the company managed to grow revenues by a handy 5.6% last year. Pleasingly, revenue has also lifted 62% in aggregate from three years ago, partly thanks to the last 12 months of growth. So we can start by confirming that the company has done a great job of growing revenues over that time.
This is in contrast to the rest of the industry, which is expected to grow by 28% over the next year, materially higher than the company's recent medium-term annualised growth rates.
In light of this, it's alarming that Zhe Jiang Headman MachineryLtd's P/S sits above the majority of other companies. Apparently many investors in the company are way more bullish than recent times would indicate and aren't willing to let go of their stock at any price. Only the boldest would assume these prices are sustainable as a continuation of recent revenue trends is likely to weigh heavily on the share price eventually.
The Key Takeaway
The strong share price surge has lead to Zhe Jiang Headman MachineryLtd's P/S soaring as well. While the price-to-sales ratio shouldn't be the defining factor in whether you buy a stock or not, it's quite a capable barometer of revenue expectations.
The fact that Zhe Jiang Headman MachineryLtd currently trades on a higher P/S relative to the industry is an oddity, since its recent three-year growth is lower than the wider industry forecast. When we observe slower-than-industry revenue growth alongside a high P/S ratio, we assume there to be a significant risk of the share price decreasing, which would result in a lower P/S ratio. If recent medium-term revenue trends continue, it will place shareholders' investments at significant risk and potential investors in danger of paying an excessive premium.
There are also other vital risk factors to consider and we've discovered 3 warning signs for Zhe Jiang Headman MachineryLtd (2 are concerning!) that you should be aware of before investing here.
If companies with solid past earnings growth is up your alley, you may wish to see this free collection of other companies with strong earnings growth and low P/E ratios.
Valuation is complex, but we're here to simplify it.
Discover if Zhe Jiang Headman MachineryLtd might be undervalued or overvalued with our detailed analysis, featuring fair value estimates, potential risks, dividends, insider trades, and its financial condition.
Access Free AnalysisHave feedback on this article? Concerned about the content? Get in touch with us directly. Alternatively, email editorial-team (at) simplywallst.com.
This article by Simply Wall St is general in nature. We provide commentary based on historical data and analyst forecasts only using an unbiased methodology and our articles are not intended to be financial advice. It does not constitute a recommendation to buy or sell any stock, and does not take account of your objectives, or your financial situation. We aim to bring you long-term focused analysis driven by fundamental data. Note that our analysis may not factor in the latest price-sensitive company announcements or qualitative material. Simply Wall St has no position in any stocks mentioned.
About SHSE:688577
Zhe Jiang Headman MachineryLtd
Manufactures and sells computer numerical control machine tools.
Flawless balance sheet with proven track record.
Market Insights

Advertisement
Community Narratives
Groundbreaking therapies that could change the treatment landscape for PTSD, fibromyalgia, MS & Alzheimer’s
Fair Value US$6.20|86.9% undervalued
CM
Community Contributor
DigitalOcean Will Grow 14% by Embracing AI with Paperspace Acquisition
Fair Value US$50.00|41.7% undervalued
NE
Community Contributor
Viant Technology: A Rising AdTech Challenger in the AI-Powered CTV Market
Fair Value US$38.61|63.2% undervalued
BL
Community Contributor
Volvo will Accelerate Forward into Electric and Autonomous Leadership in Five Years
Fair Value SEK 438.80|39.7% undervalued
UN
Community Contributor