
Advertisement
A Piece Of The Puzzle Missing From Guangdong Lyric Robot Automation Co.,Ltd.'s (SHSE:688499) 26% Share Price Climb
Guangdong Lyric Robot Automation Co.,Ltd. (SHSE:688499) shareholders have had their patience rewarded with a 26% share price jump in the last month. Unfortunately, the gains of the last month did little to right the losses of the last year with the stock still down 46% over that time.
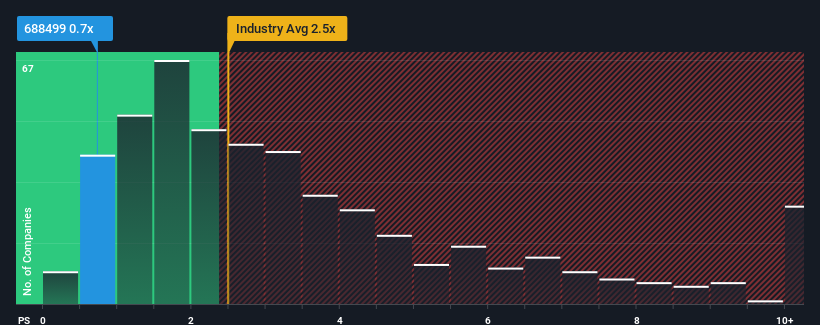
Although its price has surged higher, Guangdong Lyric Robot AutomationLtd may still be sending buy signals at present with its price-to-sales (or "P/S") ratio of 0.7x, considering almost half of all companies in the Machinery industry in China have P/S ratios greater than 2.5x and even P/S higher than 5x aren't out of the ordinary. However, the P/S might be low for a reason and it requires further investigation to determine if it's justified.
Check out our latest analysis for Guangdong Lyric Robot AutomationLtd
How Guangdong Lyric Robot AutomationLtd Has Been Performing
For instance, Guangdong Lyric Robot AutomationLtd's receding revenue in recent times would have to be some food for thought. It might be that many expect the disappointing revenue performance to continue or accelerate, which has repressed the P/S. If you like the company, you'd be hoping this isn't the case so that you could potentially pick up some stock while it's out of favour.
We don't have analyst forecasts, but you can see how recent trends are setting up the company for the future by checking out our free report on Guangdong Lyric Robot AutomationLtd's earnings, revenue and cash flow.How Is Guangdong Lyric Robot AutomationLtd's Revenue Growth Trending?
Guangdong Lyric Robot AutomationLtd's P/S ratio would be typical for a company that's only expected to deliver limited growth, and importantly, perform worse than the industry.
In reviewing the last year of financials, we were disheartened to see the company's revenues fell to the tune of 21%. Still, the latest three year period has seen an excellent 109% overall rise in revenue, in spite of its unsatisfying short-term performance. Although it's been a bumpy ride, it's still fair to say the revenue growth recently has been more than adequate for the company.
Comparing that to the industry, which is only predicted to deliver 23% growth in the next 12 months, the company's momentum is stronger based on recent medium-term annualised revenue results.
In light of this, it's peculiar that Guangdong Lyric Robot AutomationLtd's P/S sits below the majority of other companies. Apparently some shareholders believe the recent performance has exceeded its limits and have been accepting significantly lower selling prices.
What Does Guangdong Lyric Robot AutomationLtd's P/S Mean For Investors?
Guangdong Lyric Robot AutomationLtd's stock price has surged recently, but its but its P/S still remains modest. It's argued the price-to-sales ratio is an inferior measure of value within certain industries, but it can be a powerful business sentiment indicator.
We're very surprised to see Guangdong Lyric Robot AutomationLtd currently trading on a much lower than expected P/S since its recent three-year growth is higher than the wider industry forecast. Potential investors that are sceptical over continued revenue performance may be preventing the P/S ratio from matching previous strong performance. It appears many are indeed anticipating revenue instability, because the persistence of these recent medium-term conditions would normally provide a boost to the share price.
It is also worth noting that we have found 3 warning signs for Guangdong Lyric Robot AutomationLtd (2 are a bit concerning!) that you need to take into consideration.
If companies with solid past earnings growth is up your alley, you may wish to see this free collection of other companies with strong earnings growth and low P/E ratios.
New: Manage All Your Stock Portfolios in One Place
We've created the ultimate portfolio companion for stock investors, and it's free.
• Connect an unlimited number of Portfolios and see your total in one currency
• Be alerted to new Warning Signs or Risks via email or mobile
• Track the Fair Value of your stocks
Have feedback on this article? Concerned about the content? Get in touch with us directly. Alternatively, email editorial-team (at) simplywallst.com.
This article by Simply Wall St is general in nature. We provide commentary based on historical data and analyst forecasts only using an unbiased methodology and our articles are not intended to be financial advice. It does not constitute a recommendation to buy or sell any stock, and does not take account of your objectives, or your financial situation. We aim to bring you long-term focused analysis driven by fundamental data. Note that our analysis may not factor in the latest price-sensitive company announcements or qualitative material. Simply Wall St has no position in any stocks mentioned.
About SHSE:688499
Guangdong Lyric Robot AutomationLtd
Guangdong Lyric Robot Automation Co.,Ltd.
High growth potential and fair value.
Market Insights

Advertisement
Community Narratives
Kodiak AI - a potential 100 bagger opportunity?
Fair Value US$14.00|44.7% undervalued
DA
Community Contributor
A Fair Price for a Great Business Facing Real Threats
Fair Value US$383.06|13.0% undervalued
IM
Community Contributor
AXON And Shopify Integration Will Unlock Global Mobile Advertising
Fair Value US$646.30|0% overvalued
AN
Based on Analyst Price Targets