
Advertisement
- China
- /
- Electrical
- /
- SHSE:688063
The Price Is Right For Pylon Technologies Co., Ltd. (SHSE:688063) Even After Diving 28%

Pylon Technologies Co., Ltd. (SHSE:688063) shareholders that were waiting for something to happen have been dealt a blow with a 28% share price drop in the last month. For any long-term shareholders, the last month ends a year to forget by locking in a 68% share price decline.
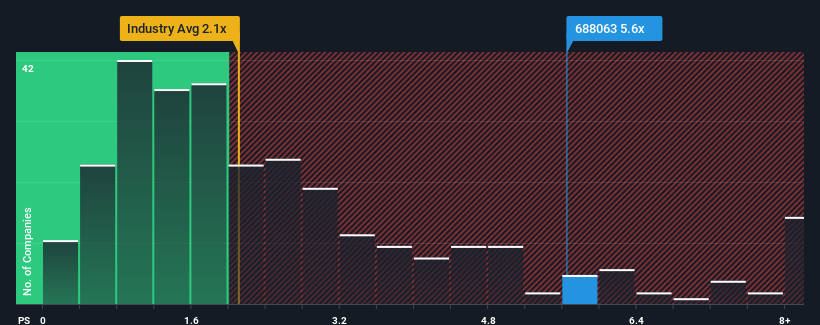
In spite of the heavy fall in price, when almost half of the companies in China's Electrical industry have price-to-sales ratios (or "P/S") below 2.1x, you may still consider Pylon Technologies as a stock not worth researching with its 5.6x P/S ratio. However, the P/S might be quite high for a reason and it requires further investigation to determine if it's justified.
Check out our latest analysis for Pylon Technologies
What Does Pylon Technologies' Recent Performance Look Like?
Pylon Technologies hasn't been tracking well recently as its declining revenue compares poorly to other companies, which have seen some growth in their revenues on average. Perhaps the market is expecting the poor revenue to reverse, justifying it's current high P/S.. If not, then existing shareholders may be extremely nervous about the viability of the share price.
If you'd like to see what analysts are forecasting going forward, you should check out our free report on Pylon Technologies.What Are Revenue Growth Metrics Telling Us About The High P/S?
The only time you'd be truly comfortable seeing a P/S as steep as Pylon Technologies' is when the company's growth is on track to outshine the industry decidedly.
Retrospectively, the last year delivered a frustrating 74% decrease to the company's top line. Even so, admirably revenue has lifted 53% in aggregate from three years ago, notwithstanding the last 12 months. Accordingly, while they would have preferred to keep the run going, shareholders would definitely welcome the medium-term rates of revenue growth.
Turning to the outlook, the next year should generate growth of 153% as estimated by the six analysts watching the company. Meanwhile, the rest of the industry is forecast to only expand by 24%, which is noticeably less attractive.
With this in mind, it's not hard to understand why Pylon Technologies' P/S is high relative to its industry peers. Apparently shareholders aren't keen to offload something that is potentially eyeing a more prosperous future.
What We Can Learn From Pylon Technologies' P/S?
Pylon Technologies' shares may have suffered, but its P/S remains high. Typically, we'd caution against reading too much into price-to-sales ratios when settling on investment decisions, though it can reveal plenty about what other market participants think about the company.
We've established that Pylon Technologies maintains its high P/S on the strength of its forecasted revenue growth being higher than the the rest of the Electrical industry, as expected. It appears that shareholders are confident in the company's future revenues, which is propping up the P/S. Unless the analysts have really missed the mark, these strong revenue forecasts should keep the share price buoyant.
And what about other risks? Every company has them, and we've spotted 4 warning signs for Pylon Technologies (of which 2 make us uncomfortable!) you should know about.
Of course, profitable companies with a history of great earnings growth are generally safer bets. So you may wish to see this free collection of other companies that have reasonable P/E ratios and have grown earnings strongly.
New: Manage All Your Stock Portfolios in One Place
We've created the ultimate portfolio companion for stock investors, and it's free.
• Connect an unlimited number of Portfolios and see your total in one currency
• Be alerted to new Warning Signs or Risks via email or mobile
• Track the Fair Value of your stocks
Have feedback on this article? Concerned about the content? Get in touch with us directly. Alternatively, email editorial-team (at) simplywallst.com.
This article by Simply Wall St is general in nature. We provide commentary based on historical data and analyst forecasts only using an unbiased methodology and our articles are not intended to be financial advice. It does not constitute a recommendation to buy or sell any stock, and does not take account of your objectives, or your financial situation. We aim to bring you long-term focused analysis driven by fundamental data. Note that our analysis may not factor in the latest price-sensitive company announcements or qualitative material. Simply Wall St has no position in any stocks mentioned.
About SHSE:688063
Flawless balance sheet with high growth potential.
Similar Companies
Market Insights

Advertisement
Community Narratives
Groundbreaking therapies that could change the treatment landscape for PTSD, fibromyalgia, MS & Alzheimer’s
Fair Value US$6.20|86.9% undervalued
CM
Community Contributor
DigitalOcean Will Grow 14% by Embracing AI with Paperspace Acquisition
Fair Value US$50.00|41.7% undervalued
NE
Community Contributor
Viant Technology: A Rising AdTech Challenger in the AI-Powered CTV Market
Fair Value US$38.61|63.2% undervalued
BL
Community Contributor
Volvo will Accelerate Forward into Electric and Autonomous Leadership in Five Years
Fair Value SEK 438.80|39.7% undervalued
UN
Community Contributor