- China
- /
- Construction
- /
- SHSE:603959
Investors Give Hunan Baili Engineering Sci&Tech Co.,Ltd (SHSE:603959) Shares A 28% Hiding


Unfortunately for some shareholders, the Hunan Baili Engineering Sci&Tech Co.,Ltd (SHSE:603959) share price has dived 28% in the last thirty days, prolonging recent pain. The recent drop completes a disastrous twelve months for shareholders, who are sitting on a 56% loss during that time.
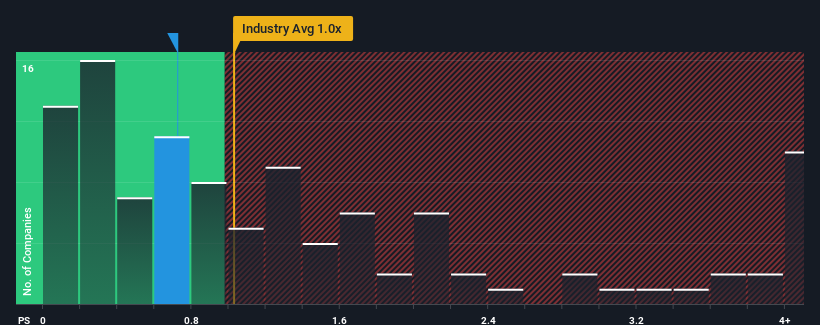
In spite of the heavy fall in price, you could still be forgiven for feeling indifferent about Hunan Baili Engineering Sci&TechLtd's P/S ratio of 0.7x, since the median price-to-sales (or "P/S") ratio for the Construction industry in China is also close to 1x. However, investors might be overlooking a clear opportunity or potential setback if there is no rational basis for the P/S.
View our latest analysis for Hunan Baili Engineering Sci&TechLtd
What Does Hunan Baili Engineering Sci&TechLtd's P/S Mean For Shareholders?
The revenue growth achieved at Hunan Baili Engineering Sci&TechLtd over the last year would be more than acceptable for most companies. One possibility is that the P/S is moderate because investors think this respectable revenue growth might not be enough to outperform the broader industry in the near future. Those who are bullish on Hunan Baili Engineering Sci&TechLtd will be hoping that this isn't the case, so that they can pick up the stock at a lower valuation.
We don't have analyst forecasts, but you can see how recent trends are setting up the company for the future by checking out our free report on Hunan Baili Engineering Sci&TechLtd's earnings, revenue and cash flow.Is There Some Revenue Growth Forecasted For Hunan Baili Engineering Sci&TechLtd?
The only time you'd be comfortable seeing a P/S like Hunan Baili Engineering Sci&TechLtd's is when the company's growth is tracking the industry closely.
If we review the last year of revenue growth, the company posted a terrific increase of 28%. Pleasingly, revenue has also lifted 81% in aggregate from three years ago, thanks to the last 12 months of growth. Therefore, it's fair to say the revenue growth recently has been superb for the company.
Comparing that recent medium-term revenue trajectory with the industry's one-year growth forecast of 15% shows it's noticeably more attractive.
With this information, we find it interesting that Hunan Baili Engineering Sci&TechLtd is trading at a fairly similar P/S compared to the industry. Apparently some shareholders believe the recent performance is at its limits and have been accepting lower selling prices.
The Final Word
Hunan Baili Engineering Sci&TechLtd's plummeting stock price has brought its P/S back to a similar region as the rest of the industry. Typically, we'd caution against reading too much into price-to-sales ratios when settling on investment decisions, though it can reveal plenty about what other market participants think about the company.
We've established that Hunan Baili Engineering Sci&TechLtd currently trades on a lower than expected P/S since its recent three-year growth is higher than the wider industry forecast. There could be some unobserved threats to revenue preventing the P/S ratio from matching this positive performance. While recent revenue trends over the past medium-term suggest that the risk of a price decline is low, investors appear to see the likelihood of revenue fluctuations in the future.
Having said that, be aware Hunan Baili Engineering Sci&TechLtd is showing 1 warning sign in our investment analysis, you should know about.
If strong companies turning a profit tickle your fancy, then you'll want to check out this free list of interesting companies that trade on a low P/E (but have proven they can grow earnings).
If you're looking to trade Hunan Baili Engineering Sci&TechLtd, open an account with the lowest-cost platform trusted by professionals, Interactive Brokers.
With clients in over 200 countries and territories, and access to 160 markets, IBKR lets you trade stocks, options, futures, forex, bonds and funds from a single integrated account.
Enjoy no hidden fees, no account minimums, and FX conversion rates as low as 0.03%, far better than what most brokers offer.
Sponsored ContentValuation is complex, but we're here to simplify it.
Discover if Hunan Baili Engineering Sci&TechLtd might be undervalued or overvalued with our detailed analysis, featuring fair value estimates, potential risks, dividends, insider trades, and its financial condition.
Access Free AnalysisHave feedback on this article? Concerned about the content? Get in touch with us directly. Alternatively, email editorial-team (at) simplywallst.com.
This article by Simply Wall St is general in nature. We provide commentary based on historical data and analyst forecasts only using an unbiased methodology and our articles are not intended to be financial advice. It does not constitute a recommendation to buy or sell any stock, and does not take account of your objectives, or your financial situation. We aim to bring you long-term focused analysis driven by fundamental data. Note that our analysis may not factor in the latest price-sensitive company announcements or qualitative material. Simply Wall St has no position in any stocks mentioned.
About SHSE:603959
Hunan Baili Engineering Sci&TechLtd
Provides engineering consulting and design, proprietary equipment manufacturing, and smart production line integration services in China.
Slightly overvalued with worrying balance sheet.
Market Insights

Community Narratives

