
Advertisement
We Think KTK Group (SHSE:603680) Can Manage Its Debt With Ease

Warren Buffett famously said, 'Volatility is far from synonymous with risk.' When we think about how risky a company is, we always like to look at its use of debt, since debt overload can lead to ruin. We note that KTK Group Co., Ltd. (SHSE:603680) does have debt on its balance sheet. But the more important question is: how much risk is that debt creating?
When Is Debt A Problem?
Debt assists a business until the business has trouble paying it off, either with new capital or with free cash flow. If things get really bad, the lenders can take control of the business. However, a more frequent (but still costly) occurrence is where a company must issue shares at bargain-basement prices, permanently diluting shareholders, just to shore up its balance sheet. Of course, debt can be an important tool in businesses, particularly capital heavy businesses. When we think about a company's use of debt, we first look at cash and debt together.
See our latest analysis for KTK Group
How Much Debt Does KTK Group Carry?
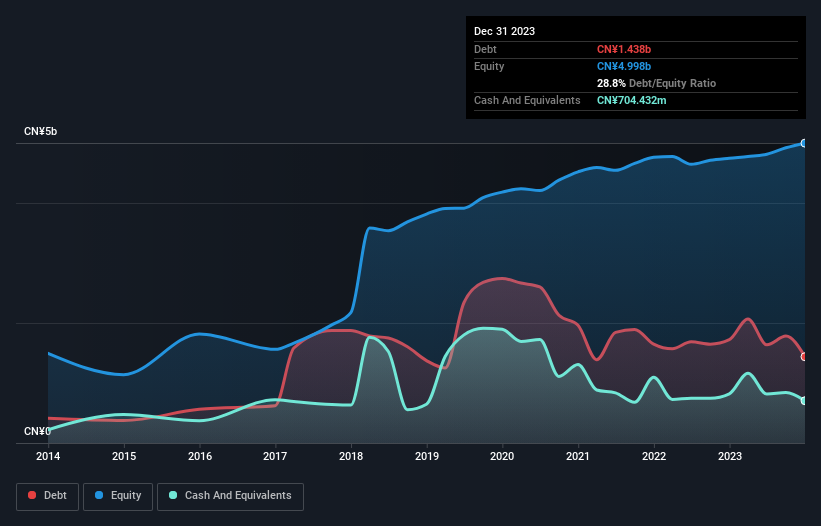
The image below, which you can click on for greater detail, shows that KTK Group had debt of CN¥1.44b at the end of December 2023, a reduction from CN¥1.72b over a year. On the flip side, it has CN¥704.4m in cash leading to net debt of about CN¥733.5m.
How Healthy Is KTK Group's Balance Sheet?
According to the last reported balance sheet, KTK Group had liabilities of CN¥3.09b due within 12 months, and liabilities of CN¥827.6m due beyond 12 months. Offsetting this, it had CN¥704.4m in cash and CN¥3.42b in receivables that were due within 12 months. So it actually has CN¥210.7m more liquid assets than total liabilities.
This surplus suggests that KTK Group has a conservative balance sheet, and could probably eliminate its debt without much difficulty.
We measure a company's debt load relative to its earnings power by looking at its net debt divided by its earnings before interest, tax, depreciation, and amortization (EBITDA) and by calculating how easily its earnings before interest and tax (EBIT) cover its interest expense (interest cover). This way, we consider both the absolute quantum of the debt, as well as the interest rates paid on it.
KTK Group's net debt to EBITDA ratio of about 1.6 suggests only moderate use of debt. And its commanding EBIT of 1k times its interest expense, implies the debt load is as light as a peacock feather. Even more impressive was the fact that KTK Group grew its EBIT by 117% over twelve months. That boost will make it even easier to pay down debt going forward. There's no doubt that we learn most about debt from the balance sheet. But it is KTK Group's earnings that will influence how the balance sheet holds up in the future. So if you're keen to discover more about its earnings, it might be worth checking out this graph of its long term earnings trend.
Finally, while the tax-man may adore accounting profits, lenders only accept cold hard cash. So the logical step is to look at the proportion of that EBIT that is matched by actual free cash flow. Over the most recent three years, KTK Group recorded free cash flow worth 74% of its EBIT, which is around normal, given free cash flow excludes interest and tax. This cold hard cash means it can reduce its debt when it wants to.
Our View
The good news is that KTK Group's demonstrated ability to cover its interest expense with its EBIT delights us like a fluffy puppy does a toddler. And that's just the beginning of the good news since its EBIT growth rate is also very heartening. Overall, we don't think KTK Group is taking any bad risks, as its debt load seems modest. So we're not worried about the use of a little leverage on the balance sheet. The balance sheet is clearly the area to focus on when you are analysing debt. However, not all investment risk resides within the balance sheet - far from it. We've identified 2 warning signs with KTK Group (at least 1 which can't be ignored) , and understanding them should be part of your investment process.
When all is said and done, sometimes its easier to focus on companies that don't even need debt. Readers can access a list of growth stocks with zero net debt 100% free, right now.
Valuation is complex, but we're here to simplify it.
Discover if KTK Group might be undervalued or overvalued with our detailed analysis, featuring fair value estimates, potential risks, dividends, insider trades, and its financial condition.
Access Free AnalysisHave feedback on this article? Concerned about the content? Get in touch with us directly. Alternatively, email editorial-team (at) simplywallst.com.
This article by Simply Wall St is general in nature. We provide commentary based on historical data and analyst forecasts only using an unbiased methodology and our articles are not intended to be financial advice. It does not constitute a recommendation to buy or sell any stock, and does not take account of your objectives, or your financial situation. We aim to bring you long-term focused analysis driven by fundamental data. Note that our analysis may not factor in the latest price-sensitive company announcements or qualitative material. Simply Wall St has no position in any stocks mentioned.
About SHSE:603680
KTK Group
Research, develops, produces, sells, and service interior systems, electrical controlling systems, and vehicle equipment for high-speed trains, metro, LRV, and ordinary rail passenger cars in China and internationally.
Excellent balance sheet with proven track record.
Similar Companies
Market Insights

Advertisement
Community Narratives
MicroStrategy: Volatile Gamble or Golden Opportunity?
Fair Value US$663.00|36.2% undervalued
BL
Community Contributor
Emerging Markets and Debt Reduction Will Propel Bath & Body Works Forward
Fair Value US$40.73|22.0% undervalued
ZW
Community Contributor
An amazing opportunity to potentially get a 100 bagger
Fair Value US$10.00|46.4% overvalued
DA
Community Contributor