
Advertisement
Zhejiang Tiantai Xianghe IndustrialLtd (SHSE:603500) Could Be Struggling To Allocate Capital

When we're researching a company, it's sometimes hard to find the warning signs, but there are some financial metrics that can help spot trouble early. When we see a declining return on capital employed (ROCE) in conjunction with a declining base of capital employed, that's often how a mature business shows signs of aging. This indicates to us that the business is not only shrinking the size of its net assets, but its returns are falling as well. On that note, looking into Zhejiang Tiantai Xianghe IndustrialLtd (SHSE:603500), we weren't too upbeat about how things were going.
Return On Capital Employed (ROCE): What Is It?
If you haven't worked with ROCE before, it measures the 'return' (pre-tax profit) a company generates from capital employed in its business. Analysts use this formula to calculate it for Zhejiang Tiantai Xianghe IndustrialLtd:
Return on Capital Employed = Earnings Before Interest and Tax (EBIT) ÷ (Total Assets - Current Liabilities)
0.08 = CN¥82m ÷ (CN¥1.2b - CN¥209m) (Based on the trailing twelve months to March 2024).
Therefore, Zhejiang Tiantai Xianghe IndustrialLtd has an ROCE of 8.0%. On its own that's a low return, but compared to the average of 5.6% generated by the Machinery industry, it's much better.
View our latest analysis for Zhejiang Tiantai Xianghe IndustrialLtd
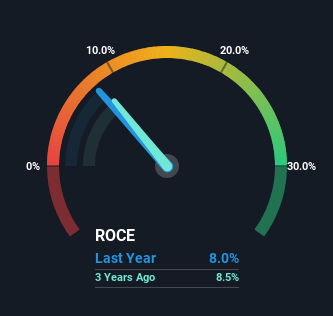
Historical performance is a great place to start when researching a stock so above you can see the gauge for Zhejiang Tiantai Xianghe IndustrialLtd's ROCE against it's prior returns. If you want to delve into the historical earnings , check out these free graphs detailing revenue and cash flow performance of Zhejiang Tiantai Xianghe IndustrialLtd.
So How Is Zhejiang Tiantai Xianghe IndustrialLtd's ROCE Trending?
There is reason to be cautious about Zhejiang Tiantai Xianghe IndustrialLtd, given the returns are trending downwards. About five years ago, returns on capital were 12%, however they're now substantially lower than that as we saw above. Meanwhile, capital employed in the business has stayed roughly the flat over the period. Companies that exhibit these attributes tend to not be shrinking, but they can be mature and facing pressure on their margins from competition. If these trends continue, we wouldn't expect Zhejiang Tiantai Xianghe IndustrialLtd to turn into a multi-bagger.
On a side note, Zhejiang Tiantai Xianghe IndustrialLtd's current liabilities have increased over the last five years to 17% of total assets, effectively distorting the ROCE to some degree. If current liabilities hadn't increased as much as they did, the ROCE could actually be even lower. Keep an eye on this ratio, because the business could encounter some new risks if this metric gets too high.
Our Take On Zhejiang Tiantai Xianghe IndustrialLtd's ROCE
All in all, the lower returns from the same amount of capital employed aren't exactly signs of a compounding machine. Despite the concerning underlying trends, the stock has actually gained 31% over the last five years, so it might be that the investors are expecting the trends to reverse. Either way, we aren't huge fans of the current trends and so with that we think you might find better investments elsewhere.
If you'd like to know more about Zhejiang Tiantai Xianghe IndustrialLtd, we've spotted 2 warning signs, and 1 of them is concerning.
If you want to search for solid companies with great earnings, check out this free list of companies with good balance sheets and impressive returns on equity.
Valuation is complex, but we're here to simplify it.
Discover if Zhejiang Tiantai Xianghe IndustrialLtd might be undervalued or overvalued with our detailed analysis, featuring fair value estimates, potential risks, dividends, insider trades, and its financial condition.
Access Free AnalysisHave feedback on this article? Concerned about the content? Get in touch with us directly. Alternatively, email editorial-team (at) simplywallst.com.
This article by Simply Wall St is general in nature. We provide commentary based on historical data and analyst forecasts only using an unbiased methodology and our articles are not intended to be financial advice. It does not constitute a recommendation to buy or sell any stock, and does not take account of your objectives, or your financial situation. We aim to bring you long-term focused analysis driven by fundamental data. Note that our analysis may not factor in the latest price-sensitive company announcements or qualitative material. Simply Wall St has no position in any stocks mentioned.
About SHSE:603500
Zhejiang Tiantai Xianghe IndustrialLtd
Zhejiang Tiantai Xianghe Industrial Co.,Ltd.
Excellent balance sheet with proven track record.
Market Insights

Advertisement
Community Narratives

BMW cruising ahead with new EVs and premium models to boost revenue 5%
Fair Value €135.07|44.5% undervalued
UN
Community Contributor
EU#2 - From Humble Beginnings to Global Powerhouse
Fair Value DKK 851.04|46.1% undervalued
TO
Community Contributor