Delixi New Energy Technology Co., Ltd.'s (SHSE:603032) Stock Retreats 28% But Revenues Haven't Escaped The Attention Of Investors


To the annoyance of some shareholders, Delixi New Energy Technology Co., Ltd. (SHSE:603032) shares are down a considerable 28% in the last month, which continues a horrid run for the company. The recent drop completes a disastrous twelve months for shareholders, who are sitting on a 63% loss during that time.
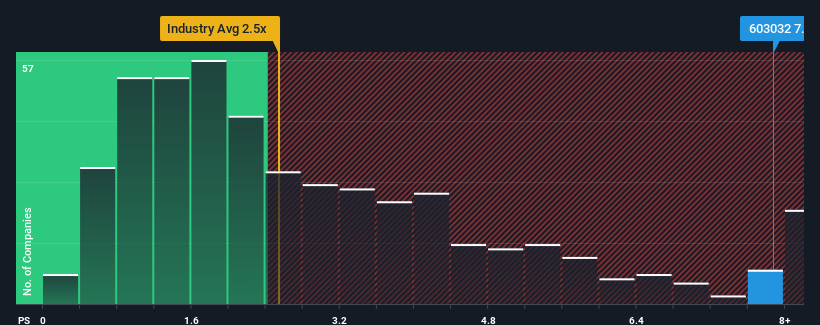
Even after such a large drop in price, when almost half of the companies in China's Machinery industry have price-to-sales ratios (or "P/S") below 2.5x, you may still consider Delixi New Energy Technology as a stock not worth researching with its 7.9x P/S ratio. Although, it's not wise to just take the P/S at face value as there may be an explanation why it's so lofty.
Check out our latest analysis for Delixi New Energy Technology
What Does Delixi New Energy Technology's P/S Mean For Shareholders?
For instance, Delixi New Energy Technology's receding revenue in recent times would have to be some food for thought. Perhaps the market believes the company can do enough to outperform the rest of the industry in the near future, which is keeping the P/S ratio high. You'd really hope so, otherwise you're paying a pretty hefty price for no particular reason.
Although there are no analyst estimates available for Delixi New Energy Technology, take a look at this free data-rich visualisation to see how the company stacks up on earnings, revenue and cash flow.What Are Revenue Growth Metrics Telling Us About The High P/S?
There's an inherent assumption that a company should far outperform the industry for P/S ratios like Delixi New Energy Technology's to be considered reasonable.
In reviewing the last year of financials, we were disheartened to see the company's revenues fell to the tune of 46%. The latest three year period has seen an incredible overall rise in revenue, a stark contrast to the last 12 months. So while the company has done a great job in the past, it's somewhat concerning to see revenue growth decline so harshly.
Comparing that recent medium-term revenue trajectory with the industry's one-year growth forecast of 24% shows it's noticeably more attractive.
With this information, we can see why Delixi New Energy Technology is trading at such a high P/S compared to the industry. Presumably shareholders aren't keen to offload something they believe will continue to outmanoeuvre the wider industry.
What We Can Learn From Delixi New Energy Technology's P/S?
A significant share price dive has done very little to deflate Delixi New Energy Technology's very lofty P/S. Using the price-to-sales ratio alone to determine if you should sell your stock isn't sensible, however it can be a practical guide to the company's future prospects.
As we suspected, our examination of Delixi New Energy Technology revealed its three-year revenue trends are contributing to its high P/S, given they look better than current industry expectations. In the eyes of shareholders, the probability of a continued growth trajectory is great enough to prevent the P/S from pulling back. Barring any significant changes to the company's ability to make money, the share price should continue to be propped up.
Before you take the next step, you should know about the 1 warning sign for Delixi New Energy Technology that we have uncovered.
If these risks are making you reconsider your opinion on Delixi New Energy Technology, explore our interactive list of high quality stocks to get an idea of what else is out there.
If you're looking to trade Delixi New Energy Technology, open an account with the lowest-cost platform trusted by professionals, Interactive Brokers.
With clients in over 200 countries and territories, and access to 160 markets, IBKR lets you trade stocks, options, futures, forex, bonds and funds from a single integrated account.
Enjoy no hidden fees, no account minimums, and FX conversion rates as low as 0.03%, far better than what most brokers offer.
Sponsored ContentNew: Manage All Your Stock Portfolios in One Place
We've created the ultimate portfolio companion for stock investors, and it's free.
• Connect an unlimited number of Portfolios and see your total in one currency
• Be alerted to new Warning Signs or Risks via email or mobile
• Track the Fair Value of your stocks
Have feedback on this article? Concerned about the content? Get in touch with us directly. Alternatively, email editorial-team (at) simplywallst.com.
This article by Simply Wall St is general in nature. We provide commentary based on historical data and analyst forecasts only using an unbiased methodology and our articles are not intended to be financial advice. It does not constitute a recommendation to buy or sell any stock, and does not take account of your objectives, or your financial situation. We aim to bring you long-term focused analysis driven by fundamental data. Note that our analysis may not factor in the latest price-sensitive company announcements or qualitative material. Simply Wall St has no position in any stocks mentioned.
About SHSE:603032
Delixi New Energy Technology
Engages in the lithium battery cutting equipment business in the People’s Republic of China.
Reasonable growth potential with adequate balance sheet.
Market Insights

Community Narratives

