Advertisement
- China
- /
- Electrical
- /
- SHSE:601616
February 2025's Top Penny Stocks To Watch

Simply Wall St
Reviewed by Simply Wall St
Amidst fluctuating global markets, with U.S. indices experiencing volatility due to geopolitical tensions and consumer spending concerns, investors are seeking opportunities in diverse areas. Penny stocks, often associated with smaller or newer companies, remain an intriguing investment area despite being considered somewhat outdated. These stocks can offer unique value propositions when backed by strong financials, providing a potential for growth that might not be immediately apparent in larger firms.
Top 10 Penny Stocks
| Name | Share Price | Market Cap | Financial Health Rating |
| DXN Holdings Bhd (KLSE:DXN) | MYR0.525 | MYR2.61B | ★★★★★★ |
| Bosideng International Holdings (SEHK:3998) | HK$3.88 | HK$44.54B | ★★★★★★ |
| Datasonic Group Berhad (KLSE:DSONIC) | MYR0.305 | MYR848.56M | ★★★★★★ |
| Angler Gaming (NGM:ANGL) | SEK3.94 | SEK295.44M | ★★★★★★ |
| T.A.C. Consumer (SET:TACC) | THB4.16 | THB2.5B | ★★★★★★ |
| Warpaint London (AIM:W7L) | £3.95 | £319.11M | ★★★★★★ |
| Hil Industries Berhad (KLSE:HIL) | MYR0.855 | MYR283.81M | ★★★★★★ |
| Foresight Group Holdings (LSE:FSG) | £3.95 | £450.28M | ★★★★★★ |
| Embark Early Education (ASX:EVO) | A$0.79 | A$144.95M | ★★★★☆☆ |
| Next 15 Group (AIM:NFG) | £3.05 | £303.34M | ★★★★☆☆ |
Click here to see the full list of 5,710 stocks from our Penny Stocks screener.
Here's a peek at a few of the choices from the screener.
Dubai Investments PJSC (DFM:DIC)
Simply Wall St Financial Health Rating: ★★★★★☆
Overview: Dubai Investments PJSC operates in property, investment, manufacturing, contracting, and services sectors both in the United Arab Emirates and internationally with a market cap of AED9.65 billion.
Operations: The company's revenue is derived from three primary segments: Property (AED2.21 billion), Manufacturing, Contracting and Services (AED1.24 billion), and Investments (AED330.77 million).
Market Cap: AED9.65B
Dubai Investments PJSC, with a market cap of AED9.65 billion, operates across multiple sectors including property and manufacturing. The company has shown significant profit growth over the past five years, though recent earnings growth slowed to 3%, slightly above the industry average. Despite a low return on equity at 6.7%, its debt reduction from 51.5% to 39.3% over five years is positive, and short-term assets exceed liabilities comfortably. However, interest coverage by EBIT is below optimal levels at 2.8x, indicating potential financial pressure if not addressed further. The company's price-to-earnings ratio of 10x suggests it may be undervalued compared to the broader AE market average of 13.1x.
- Click to explore a detailed breakdown of our findings in Dubai Investments PJSC's financial health report.
- Learn about Dubai Investments PJSC's future growth trajectory here.
BRC Asia (SGX:BEC)
Simply Wall St Financial Health Rating: ★★★★★★
Overview: BRC Asia Limited, with a market cap of SGD825.79 million, specializes in the prefabrication of steel reinforcement for concrete across Singapore and several international markets including Australia, Brunei, Hong Kong, Indonesia, Malaysia, Thailand, and India.
Operations: The company's revenue is derived from two main segments: Trading, which accounts for SGD217.69 million, and Fabrication and Manufacturing, contributing SGD1.26 billion.
Market Cap: SGD825.79M
BRC Asia Limited, with a market cap of SGD825.79 million, has shown robust financial health and operational efficiency. The company's earnings have grown significantly by 26% annually over the past five years, supported by strong revenue from its Fabrication and Manufacturing segment (SGD1.26 billion). Despite a low return on equity at 19.7%, BRC has managed to reduce its debt-to-equity ratio from 125.4% to 46.5%, indicating improved leverage management. Its short-term assets comfortably cover both short-term and long-term liabilities, while interest payments are well-covered by EBIT (14x coverage), suggesting solid financial stability amidst an unstable dividend track record.
- Unlock comprehensive insights into our analysis of BRC Asia stock in this financial health report.
- Evaluate BRC Asia's prospects by accessing our earnings growth report.
Shanghai Guangdian Electric Group (SHSE:601616)
Simply Wall St Financial Health Rating: ★★★★★★
Overview: Shanghai Guangdian Electric Group Co., Ltd. operates in the electrical equipment industry and has a market capitalization of approximately CN¥3.93 billion.
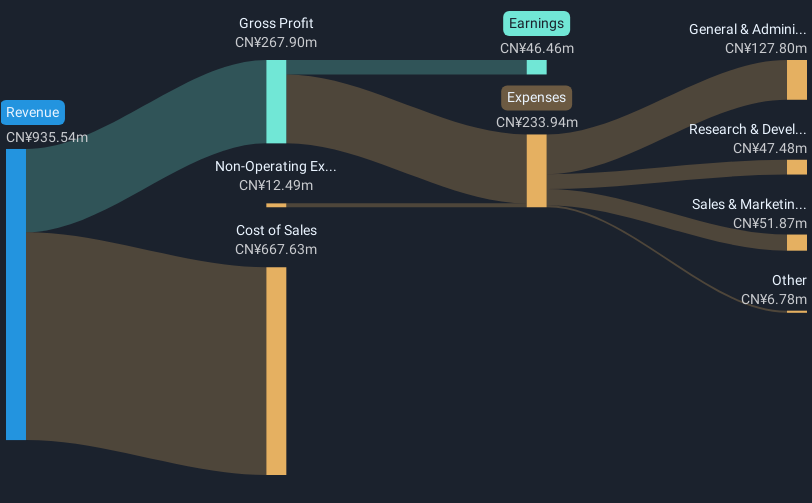
Operations: The company generates revenue of CN¥935.54 million from its Transmission and Distribution and Control Equipment Manufacturing segment.
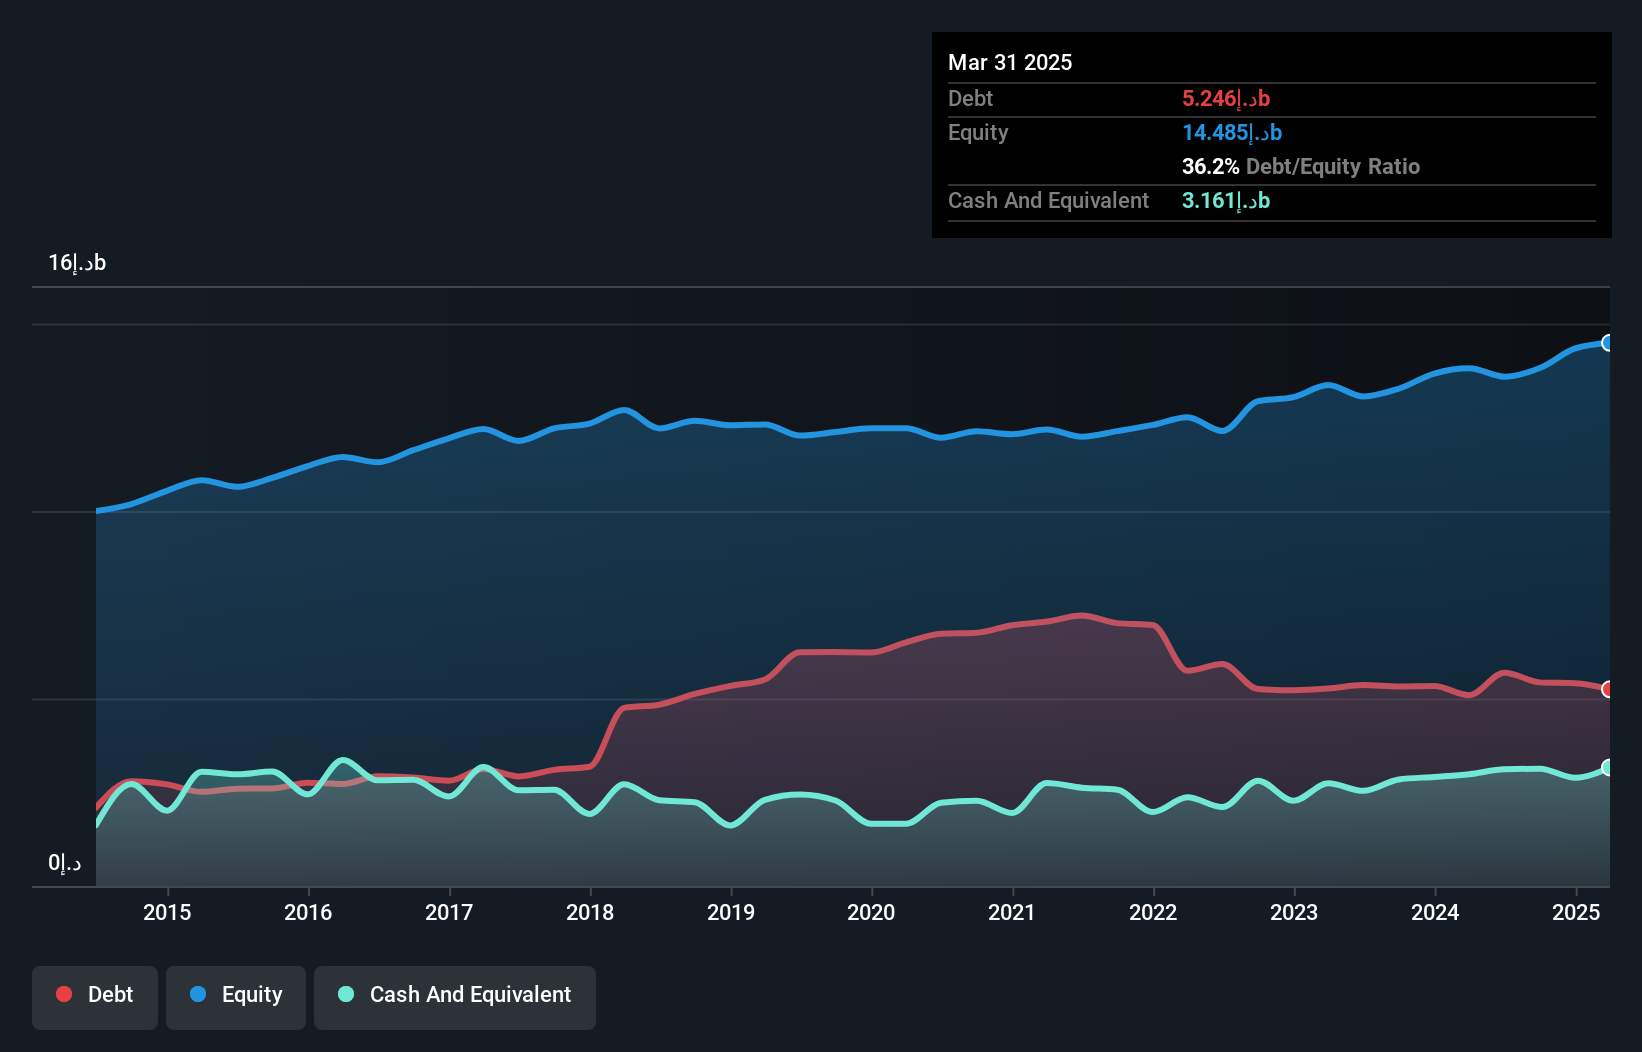
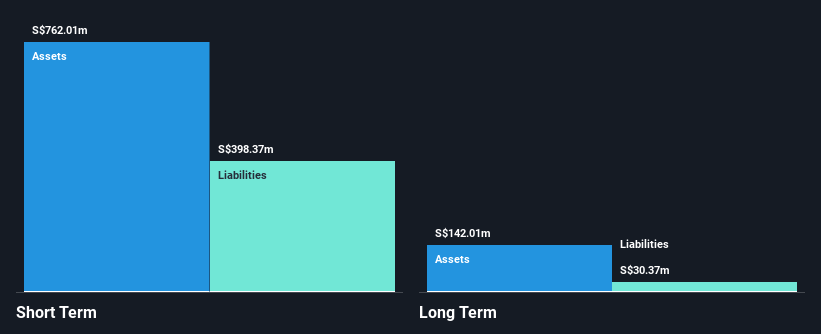
Market Cap: CN¥3.93B
Shanghai Guangdian Electric Group, with a market cap of CN¥3.93 billion, has demonstrated significant earnings growth of 1568% over the past year despite a low return on equity at 2.7%. The company operates debt-free, mitigating interest payment concerns and enhancing financial flexibility. Short-term assets of CN¥1.7 billion comfortably cover both short-term and long-term liabilities, indicating sound liquidity management. However, its share price has been highly volatile recently, and profits were impacted by a large one-off gain of CN¥15.6 million in the last fiscal year ending September 2024. Despite these fluctuations, shareholders have not faced meaningful dilution recently.
- Dive into the specifics of Shanghai Guangdian Electric Group here with our thorough balance sheet health report.
- Gain insights into Shanghai Guangdian Electric Group's historical outcomes by reviewing our past performance report.
Summing It All Up
- Take a closer look at our Penny Stocks list of 5,710 companies by clicking here.
- Are any of these part of your asset mix? Tap into the analytical power of Simply Wall St's portfolio to get a 360-degree view on how they're shaping up.
- Maximize your investment potential with Simply Wall St, the comprehensive app that offers global market insights for free.
Contemplating Other Strategies?
- Explore high-performing small cap companies that haven't yet garnered significant analyst attention.
- Jump on the AI train with fast growing tech companies forging a new era of innovation.
- Find companies with promising cash flow potential yet trading below their fair value.
This article by Simply Wall St is general in nature. We provide commentary based on historical data and analyst forecasts only using an unbiased methodology and our articles are not intended to be financial advice. It does not constitute a recommendation to buy or sell any stock, and does not take account of your objectives, or your financial situation. We aim to bring you long-term focused analysis driven by fundamental data. Note that our analysis may not factor in the latest price-sensitive company announcements or qualitative material. Simply Wall St has no position in any stocks mentioned.
New: Manage All Your Stock Portfolios in One Place
We've created the ultimate portfolio companion for stock investors, and it's free.
• Connect an unlimited number of Portfolios and see your total in one currency
• Be alerted to new Warning Signs or Risks via email or mobile
• Track the Fair Value of your stocks
Have feedback on this article? Concerned about the content? Get in touch with us directly. Alternatively, email editorial-team@simplywallst.com
About SHSE:601616
Shanghai Guangdian Electric Group
Shanghai Guangdian Electric Group Co., Ltd.
Flawless balance sheet with proven track record.
Market Insights

Advertisement
Community Narratives
Pinterest will surge as advertising innovations ignite revenue growth
Fair Value US$42.63|27.0% undervalued
BR
Community Contributor
Brambles' Revenue Set to Climb 14% with Profit Margins Following
Fair Value AU$21.90|5.9% overvalued
RO
Community Contributor
Challenging Future for STG as Organic Sales Decline by 8.8%
Fair Value DKK 116.13|26.8% undervalued
KA
Community Contributor