Some Confidence Is Lacking In Shang Gong Group Co., Ltd. (SHSE:600843) As Shares Slide 25%


Shang Gong Group Co., Ltd. (SHSE:600843) shareholders that were waiting for something to happen have been dealt a blow with a 25% share price drop in the last month. Instead of being rewarded, shareholders who have already held through the last twelve months are now sitting on a 22% share price drop.
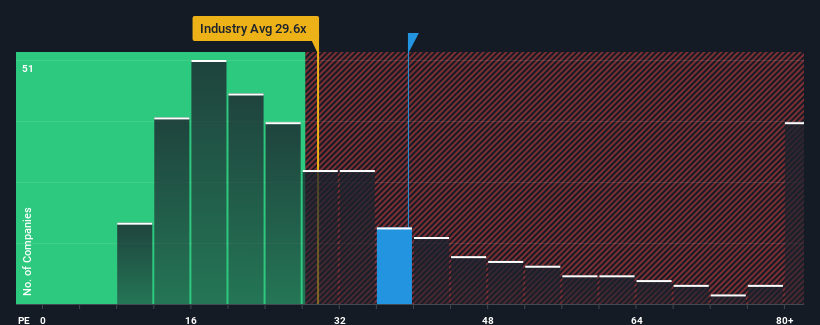
Although its price has dipped substantially, Shang Gong Group may still be sending bearish signals at the moment with its price-to-earnings (or "P/E") ratio of 39.3x, since almost half of all companies in China have P/E ratios under 30x and even P/E's lower than 18x are not unusual. However, the P/E might be high for a reason and it requires further investigation to determine if it's justified.
Shang Gong Group has been doing a good job lately as it's been growing earnings at a solid pace. It might be that many expect the respectable earnings performance to beat most other companies over the coming period, which has increased investors’ willingness to pay up for the stock. If not, then existing shareholders may be a little nervous about the viability of the share price.
Check out our latest analysis for Shang Gong Group
What Are Growth Metrics Telling Us About The High P/E?
Shang Gong Group's P/E ratio would be typical for a company that's expected to deliver solid growth, and importantly, perform better than the market.
Retrospectively, the last year delivered an exceptional 22% gain to the company's bottom line. The latest three year period has also seen an excellent 31% overall rise in EPS, aided by its short-term performance. Therefore, it's fair to say the earnings growth recently has been superb for the company.
This is in contrast to the rest of the market, which is expected to grow by 41% over the next year, materially higher than the company's recent medium-term annualised growth rates.
With this information, we find it concerning that Shang Gong Group is trading at a P/E higher than the market. It seems most investors are ignoring the fairly limited recent growth rates and are hoping for a turnaround in the company's business prospects. There's a good chance existing shareholders are setting themselves up for future disappointment if the P/E falls to levels more in line with recent growth rates.
The Key Takeaway
Shang Gong Group's P/E hasn't come down all the way after its stock plunged. Using the price-to-earnings ratio alone to determine if you should sell your stock isn't sensible, however it can be a practical guide to the company's future prospects.
Our examination of Shang Gong Group revealed its three-year earnings trends aren't impacting its high P/E anywhere near as much as we would have predicted, given they look worse than current market expectations. When we see weak earnings with slower than market growth, we suspect the share price is at risk of declining, sending the high P/E lower. If recent medium-term earnings trends continue, it will place shareholders' investments at significant risk and potential investors in danger of paying an excessive premium.
Having said that, be aware Shang Gong Group is showing 3 warning signs in our investment analysis, and 1 of those is concerning.
If these risks are making you reconsider your opinion on Shang Gong Group, explore our interactive list of high quality stocks to get an idea of what else is out there.
New: Manage All Your Stock Portfolios in One Place
We've created the ultimate portfolio companion for stock investors, and it's free.
• Connect an unlimited number of Portfolios and see your total in one currency
• Be alerted to new Warning Signs or Risks via email or mobile
• Track the Fair Value of your stocks
Have feedback on this article? Concerned about the content? Get in touch with us directly. Alternatively, email editorial-team (at) simplywallst.com.
This article by Simply Wall St is general in nature. We provide commentary based on historical data and analyst forecasts only using an unbiased methodology and our articles are not intended to be financial advice. It does not constitute a recommendation to buy or sell any stock, and does not take account of your objectives, or your financial situation. We aim to bring you long-term focused analysis driven by fundamental data. Note that our analysis may not factor in the latest price-sensitive company announcements or qualitative material. Simply Wall St has no position in any stocks mentioned.
About SHSE:600843
Shang Gong Group
Engages in research and development, production, and sale of industrial and household sewing machines in China and internationally.
Mediocre balance sheet and slightly overvalued.
Market Insights

Community Narratives

