- China
- /
- Construction
- /
- SHSE:600769
Wuhan Xianglong Power Industry Co.Ltd's (SHSE:600769) 25% Share Price Plunge Could Signal Some Risk

The Wuhan Xianglong Power Industry Co.Ltd (SHSE:600769) share price has softened a substantial 25% over the previous 30 days, handing back much of the gains the stock has made lately. Longer-term shareholders would now have taken a real hit with the stock declining 3.9% in the last year.
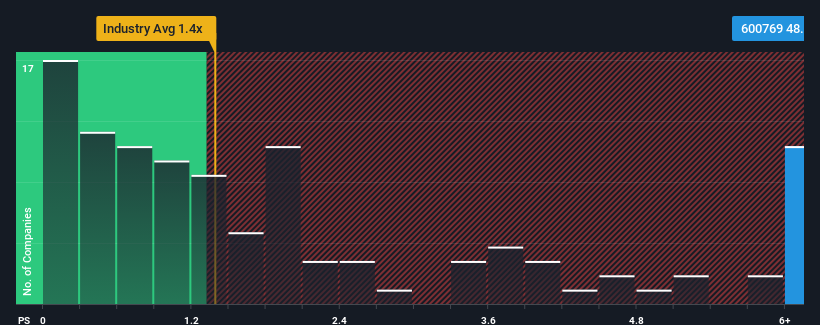
Although its price has dipped substantially, you could still be forgiven for thinking Wuhan Xianglong Power IndustryLtd is a stock to steer clear of with a price-to-sales ratios (or "P/S") of 48.8x, considering almost half the companies in China's Construction industry have P/S ratios below 1.4x. However, the P/S might be quite high for a reason and it requires further investigation to determine if it's justified.
See our latest analysis for Wuhan Xianglong Power IndustryLtd

How Has Wuhan Xianglong Power IndustryLtd Performed Recently?
Wuhan Xianglong Power IndustryLtd has been doing a good job lately as it's been growing revenue at a solid pace. One possibility is that the P/S ratio is high because investors think this respectable revenue growth will be enough to outperform the broader industry in the near future. If not, then existing shareholders may be a little nervous about the viability of the share price.
Although there are no analyst estimates available for Wuhan Xianglong Power IndustryLtd, take a look at this free data-rich visualisation to see how the company stacks up on earnings, revenue and cash flow.What Are Revenue Growth Metrics Telling Us About The High P/S?
In order to justify its P/S ratio, Wuhan Xianglong Power IndustryLtd would need to produce outstanding growth that's well in excess of the industry.
If we review the last year of revenue growth, the company posted a worthy increase of 12%. This was backed up an excellent period prior to see revenue up by 44% in total over the last three years. Therefore, it's fair to say the revenue growth recently has been superb for the company.
Weighing that recent medium-term revenue trajectory against the broader industry's one-year forecast for expansion of 12% shows it's about the same on an annualised basis.
In light of this, it's curious that Wuhan Xianglong Power IndustryLtd's P/S sits above the majority of other companies. Apparently many investors in the company are more bullish than recent times would indicate and aren't willing to let go of their stock right now. Although, additional gains will be difficult to achieve as a continuation of recent revenue trends would weigh down the share price eventually.
What Does Wuhan Xianglong Power IndustryLtd's P/S Mean For Investors?
A significant share price dive has done very little to deflate Wuhan Xianglong Power IndustryLtd's very lofty P/S. It's argued the price-to-sales ratio is an inferior measure of value within certain industries, but it can be a powerful business sentiment indicator.
We didn't expect to see Wuhan Xianglong Power IndustryLtd trade at such a high P/S considering its last three-year revenue growth has only been on par with the rest of the industry. When we see average revenue with industry-like growth combined with a high P/S, we suspect the share price is at risk of declining, bringing the P/S back in line with the industry too. If recent medium-term revenue trends continue, it will place shareholders' investments at risk and potential investors in danger of paying an unnecessary premium.
Having said that, be aware Wuhan Xianglong Power IndustryLtd is showing 1 warning sign in our investment analysis, you should know about.
If these risks are making you reconsider your opinion on Wuhan Xianglong Power IndustryLtd, explore our interactive list of high quality stocks to get an idea of what else is out there.
Valuation is complex, but we're here to simplify it.
Discover if Wuhan Xianglong Power IndustryLtd might be undervalued or overvalued with our detailed analysis, featuring fair value estimates, potential risks, dividends, insider trades, and its financial condition.
Access Free AnalysisHave feedback on this article? Concerned about the content? Get in touch with us directly. Alternatively, email editorial-team (at) simplywallst.com.
This article by Simply Wall St is general in nature. We provide commentary based on historical data and analyst forecasts only using an unbiased methodology and our articles are not intended to be financial advice. It does not constitute a recommendation to buy or sell any stock, and does not take account of your objectives, or your financial situation. We aim to bring you long-term focused analysis driven by fundamental data. Note that our analysis may not factor in the latest price-sensitive company announcements or qualitative material. Simply Wall St has no position in any stocks mentioned.
About SHSE:600769
Wuhan Xianglong Power IndustryLtd
Engages in the water supply and construction businesses in China.
Flawless balance sheet with acceptable track record.
Market Insights
Community Narratives


