- China
- /
- Trade Distributors
- /
- SHSE:600648
Investors Don't See Light At End Of Shanghai Waigaoqiao Free Trade Zone Group Co., Ltd.'s (SHSE:600648) Tunnel


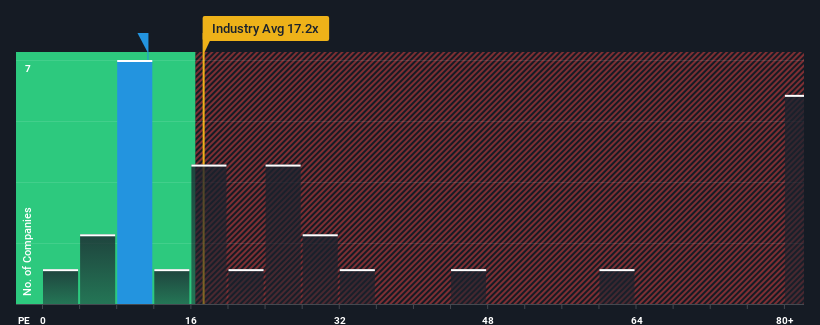
Shanghai Waigaoqiao Free Trade Zone Group Co., Ltd.'s (SHSE:600648) price-to-earnings (or "P/E") ratio of 11.3x might make it look like a strong buy right now compared to the market in China, where around half of the companies have P/E ratios above 30x and even P/E's above 55x are quite common. Nonetheless, we'd need to dig a little deeper to determine if there is a rational basis for the highly reduced P/E.
As an illustration, earnings have deteriorated at Shanghai Waigaoqiao Free Trade Zone Group over the last year, which is not ideal at all. One possibility is that the P/E is low because investors think the company won't do enough to avoid underperforming the broader market in the near future. However, if this doesn't eventuate then existing shareholders may be feeling optimistic about the future direction of the share price.
View our latest analysis for Shanghai Waigaoqiao Free Trade Zone Group
Is There Any Growth For Shanghai Waigaoqiao Free Trade Zone Group?
Shanghai Waigaoqiao Free Trade Zone Group's P/E ratio would be typical for a company that's expected to deliver very poor growth or even falling earnings, and importantly, perform much worse than the market.
Taking a look back first, the company's earnings per share growth last year wasn't something to get excited about as it posted a disappointing decline of 25%. That put a dampener on the good run it was having over the longer-term as its three-year EPS growth is still a noteworthy 28% in total. So we can start by confirming that the company has generally done a good job of growing earnings over that time, even though it had some hiccups along the way.
This is in contrast to the rest of the market, which is expected to grow by 34% over the next year, materially higher than the company's recent medium-term annualised growth rates.
In light of this, it's understandable that Shanghai Waigaoqiao Free Trade Zone Group's P/E sits below the majority of other companies. It seems most investors are expecting to see the recent limited growth rates continue into the future and are only willing to pay a reduced amount for the stock.
The Bottom Line On Shanghai Waigaoqiao Free Trade Zone Group's P/E
We'd say the price-to-earnings ratio's power isn't primarily as a valuation instrument but rather to gauge current investor sentiment and future expectations.
As we suspected, our examination of Shanghai Waigaoqiao Free Trade Zone Group revealed its three-year earnings trends are contributing to its low P/E, given they look worse than current market expectations. At this stage investors feel the potential for an improvement in earnings isn't great enough to justify a higher P/E ratio. If recent medium-term earnings trends continue, it's hard to see the share price rising strongly in the near future under these circumstances.
Don't forget that there may be other risks. For instance, we've identified 2 warning signs for Shanghai Waigaoqiao Free Trade Zone Group (1 makes us a bit uncomfortable) you should be aware of.
If P/E ratios interest you, you may wish to see this free collection of other companies with strong earnings growth and low P/E ratios.
If you're looking to trade Shanghai Waigaoqiao Free Trade Zone Group, open an account with the lowest-cost platform trusted by professionals, Interactive Brokers.
With clients in over 200 countries and territories, and access to 160 markets, IBKR lets you trade stocks, options, futures, forex, bonds and funds from a single integrated account.
Enjoy no hidden fees, no account minimums, and FX conversion rates as low as 0.03%, far better than what most brokers offer.
Sponsored ContentNew: Manage All Your Stock Portfolios in One Place
We've created the ultimate portfolio companion for stock investors, and it's free.
• Connect an unlimited number of Portfolios and see your total in one currency
• Be alerted to new Warning Signs or Risks via email or mobile
• Track the Fair Value of your stocks
Have feedback on this article? Concerned about the content? Get in touch with us directly. Alternatively, email editorial-team (at) simplywallst.com.
This article by Simply Wall St is general in nature. We provide commentary based on historical data and analyst forecasts only using an unbiased methodology and our articles are not intended to be financial advice. It does not constitute a recommendation to buy or sell any stock, and does not take account of your objectives, or your financial situation. We aim to bring you long-term focused analysis driven by fundamental data. Note that our analysis may not factor in the latest price-sensitive company announcements or qualitative material. Simply Wall St has no position in any stocks mentioned.
About SHSE:600648
Shanghai Waigaoqiao Free Trade Zone Group
Shanghai Waigaoqiao Free Trade Zone Group Co., Ltd.
Proven track record average dividend payer.
Market Insights

Community Narratives

