- China
- /
- Trade Distributors
- /
- SHSE:600648
Capital Allocation Trends At Shanghai Waigaoqiao Free Trade Zone Group (SHSE:600648) Aren't Ideal


If you're not sure where to start when looking for the next multi-bagger, there are a few key trends you should keep an eye out for. Firstly, we'd want to identify a growing return on capital employed (ROCE) and then alongside that, an ever-increasing base of capital employed. This shows us that it's a compounding machine, able to continually reinvest its earnings back into the business and generate higher returns. In light of that, when we looked at Shanghai Waigaoqiao Free Trade Zone Group (SHSE:600648) and its ROCE trend, we weren't exactly thrilled.
Understanding Return On Capital Employed (ROCE)
For those that aren't sure what ROCE is, it measures the amount of pre-tax profits a company can generate from the capital employed in its business. The formula for this calculation on Shanghai Waigaoqiao Free Trade Zone Group is:
Return on Capital Employed = Earnings Before Interest and Tax (EBIT) ÷ (Total Assets - Current Liabilities)
0.072 = CN¥1.7b ÷ (CN¥42b - CN¥19b) (Based on the trailing twelve months to September 2023).
Thus, Shanghai Waigaoqiao Free Trade Zone Group has an ROCE of 7.2%. On its own that's a low return on capital but it's in line with the industry's average returns of 7.3%.
View our latest analysis for Shanghai Waigaoqiao Free Trade Zone Group
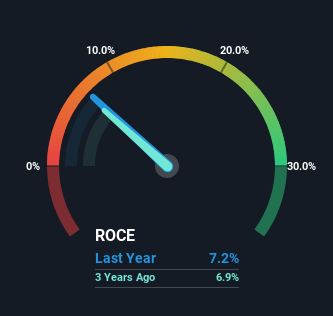
Historical performance is a great place to start when researching a stock so above you can see the gauge for Shanghai Waigaoqiao Free Trade Zone Group's ROCE against it's prior returns. If you're interested in investigating Shanghai Waigaoqiao Free Trade Zone Group's past further, check out this free graph covering Shanghai Waigaoqiao Free Trade Zone Group's past earnings, revenue and cash flow.
What The Trend Of ROCE Can Tell Us
Unfortunately, the trend isn't great with ROCE falling from 9.1% five years ago, while capital employed has grown 34%. That being said, Shanghai Waigaoqiao Free Trade Zone Group raised some capital prior to their latest results being released, so that could partly explain the increase in capital employed. Shanghai Waigaoqiao Free Trade Zone Group probably hasn't received a full year of earnings yet from the new funds it raised, so these figures should be taken with a grain of salt. It's also worth noting the company's latest EBIT figure is within 10% of the previous year, so it's fair to assign the ROCE drop largely to the capital raise.
Another thing to note, Shanghai Waigaoqiao Free Trade Zone Group has a high ratio of current liabilities to total assets of 44%. This effectively means that suppliers (or short-term creditors) are funding a large portion of the business, so just be aware that this can introduce some elements of risk. Ideally we'd like to see this reduce as that would mean fewer obligations bearing risks.
The Bottom Line
We're a bit apprehensive about Shanghai Waigaoqiao Free Trade Zone Group because despite more capital being deployed in the business, returns on that capital and sales have both fallen. Investors haven't taken kindly to these developments, since the stock has declined 36% from where it was five years ago. With underlying trends that aren't great in these areas, we'd consider looking elsewhere.
One final note, you should learn about the 2 warning signs we've spotted with Shanghai Waigaoqiao Free Trade Zone Group (including 1 which makes us a bit uncomfortable) .
If you want to search for solid companies with great earnings, check out this free list of companies with good balance sheets and impressive returns on equity.
If you're looking to trade Shanghai Waigaoqiao Free Trade Zone Group, open an account with the lowest-cost platform trusted by professionals, Interactive Brokers.
With clients in over 200 countries and territories, and access to 160 markets, IBKR lets you trade stocks, options, futures, forex, bonds and funds from a single integrated account.
Enjoy no hidden fees, no account minimums, and FX conversion rates as low as 0.03%, far better than what most brokers offer.
Sponsored ContentNew: Manage All Your Stock Portfolios in One Place
We've created the ultimate portfolio companion for stock investors, and it's free.
• Connect an unlimited number of Portfolios and see your total in one currency
• Be alerted to new Warning Signs or Risks via email or mobile
• Track the Fair Value of your stocks
Have feedback on this article? Concerned about the content? Get in touch with us directly. Alternatively, email editorial-team (at) simplywallst.com.
This article by Simply Wall St is general in nature. We provide commentary based on historical data and analyst forecasts only using an unbiased methodology and our articles are not intended to be financial advice. It does not constitute a recommendation to buy or sell any stock, and does not take account of your objectives, or your financial situation. We aim to bring you long-term focused analysis driven by fundamental data. Note that our analysis may not factor in the latest price-sensitive company announcements or qualitative material. Simply Wall St has no position in any stocks mentioned.
About SHSE:600648
Shanghai Waigaoqiao Free Trade Zone Group
Shanghai Waigaoqiao Free Trade Zone Group Co., Ltd.
Proven track record average dividend payer.
Market Insights

Community Narratives

