- China
- /
- Electrical
- /
- SHSE:600580
Wolong Electric GroupLtd (SHSE:600580) Will Want To Turn Around Its Return Trends


If we want to find a stock that could multiply over the long term, what are the underlying trends we should look for? Firstly, we'd want to identify a growing return on capital employed (ROCE) and then alongside that, an ever-increasing base of capital employed. Basically this means that a company has profitable initiatives that it can continue to reinvest in, which is a trait of a compounding machine. Having said that, from a first glance at Wolong Electric GroupLtd (SHSE:600580) we aren't jumping out of our chairs at how returns are trending, but let's have a deeper look.
Return On Capital Employed (ROCE): What Is It?
For those who don't know, ROCE is a measure of a company's yearly pre-tax profit (its return), relative to the capital employed in the business. Analysts use this formula to calculate it for Wolong Electric GroupLtd:
Return on Capital Employed = Earnings Before Interest and Tax (EBIT) ÷ (Total Assets - Current Liabilities)
0.065 = CN¥940m ÷ (CN¥26b - CN¥12b) (Based on the trailing twelve months to September 2024).
Thus, Wolong Electric GroupLtd has an ROCE of 6.5%. In absolute terms, that's a low return but it's around the Electrical industry average of 5.8%.
Check out our latest analysis for Wolong Electric GroupLtd
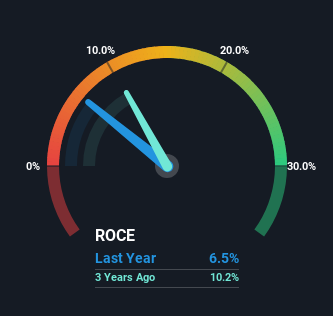
In the above chart we have measured Wolong Electric GroupLtd's prior ROCE against its prior performance, but the future is arguably more important. If you'd like, you can check out the forecasts from the analysts covering Wolong Electric GroupLtd for free.
What Does the ROCE Trend For Wolong Electric GroupLtd Tell Us?
On the surface, the trend of ROCE at Wolong Electric GroupLtd doesn't inspire confidence. Over the last five years, returns on capital have decreased to 6.5% from 10.0% five years ago. Meanwhile, the business is utilizing more capital but this hasn't moved the needle much in terms of sales in the past 12 months, so this could reflect longer term investments. It's worth keeping an eye on the company's earnings from here on to see if these investments do end up contributing to the bottom line.
On a separate but related note, it's important to know that Wolong Electric GroupLtd has a current liabilities to total assets ratio of 45%, which we'd consider pretty high. This can bring about some risks because the company is basically operating with a rather large reliance on its suppliers or other sorts of short-term creditors. While it's not necessarily a bad thing, it can be beneficial if this ratio is lower.
The Key Takeaway
To conclude, we've found that Wolong Electric GroupLtd is reinvesting in the business, but returns have been falling. Since the stock has gained an impressive 96% over the last five years, investors must think there's better things to come. Ultimately, if the underlying trends persist, we wouldn't hold our breath on it being a multi-bagger going forward.
Wolong Electric GroupLtd does have some risks though, and we've spotted 3 warning signs for Wolong Electric GroupLtd that you might be interested in.
While Wolong Electric GroupLtd isn't earning the highest return, check out this free list of companies that are earning high returns on equity with solid balance sheets.
Valuation is complex, but we're here to simplify it.
Discover if Wolong Electric GroupLtd might be undervalued or overvalued with our detailed analysis, featuring fair value estimates, potential risks, dividends, insider trades, and its financial condition.
Access Free AnalysisHave feedback on this article? Concerned about the content? Get in touch with us directly. Alternatively, email editorial-team (at) simplywallst.com.
This article by Simply Wall St is general in nature. We provide commentary based on historical data and analyst forecasts only using an unbiased methodology and our articles are not intended to be financial advice. It does not constitute a recommendation to buy or sell any stock, and does not take account of your objectives, or your financial situation. We aim to bring you long-term focused analysis driven by fundamental data. Note that our analysis may not factor in the latest price-sensitive company announcements or qualitative material. Simply Wall St has no position in any stocks mentioned.
About SHSE:600580
Wolong Electric GroupLtd
Manufactures and sells motors and drives worldwide.
Flawless balance sheet with proven track record and pays a dividend.
Similar Companies
Market Insights

Community Narratives

