- China
- /
- Trade Distributors
- /
- SHSE:600421
Some Hubei Huarong Holding Co.,Ltd. (SHSE:600421) Shareholders Look For Exit As Shares Take 30% Pounding


To the annoyance of some shareholders, Hubei Huarong Holding Co.,Ltd. (SHSE:600421) shares are down a considerable 30% in the last month, which continues a horrid run for the company. The drop over the last 30 days has capped off a tough year for shareholders, with the share price down 44% in that time.
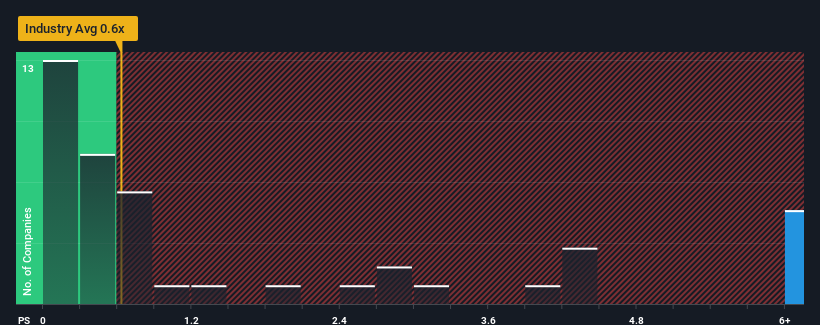
Although its price has dipped substantially, you could still be forgiven for thinking Hubei Huarong HoldingLtd is a stock to steer clear of with a price-to-sales ratios (or "P/S") of 8.5x, considering almost half the companies in China's Trade Distributors industry have P/S ratios below 0.6x. Nonetheless, we'd need to dig a little deeper to determine if there is a rational basis for the highly elevated P/S.
See our latest analysis for Hubei Huarong HoldingLtd
What Does Hubei Huarong HoldingLtd's Recent Performance Look Like?
Revenue has risen firmly for Hubei Huarong HoldingLtd recently, which is pleasing to see. One possibility is that the P/S ratio is high because investors think this respectable revenue growth will be enough to outperform the broader industry in the near future. If not, then existing shareholders may be a little nervous about the viability of the share price.
Want the full picture on earnings, revenue and cash flow for the company? Then our free report on Hubei Huarong HoldingLtd will help you shine a light on its historical performance.What Are Revenue Growth Metrics Telling Us About The High P/S?
Hubei Huarong HoldingLtd's P/S ratio would be typical for a company that's expected to deliver very strong growth, and importantly, perform much better than the industry.
Retrospectively, the last year delivered an exceptional 18% gain to the company's top line. The strong recent performance means it was also able to grow revenue by 32% in total over the last three years. Therefore, it's fair to say the revenue growth recently has been superb for the company.
Comparing that to the industry, which is predicted to deliver 16% growth in the next 12 months, the company's momentum is weaker, based on recent medium-term annualised revenue results.
With this in mind, we find it worrying that Hubei Huarong HoldingLtd's P/S exceeds that of its industry peers. Apparently many investors in the company are way more bullish than recent times would indicate and aren't willing to let go of their stock at any price. Only the boldest would assume these prices are sustainable as a continuation of recent revenue trends is likely to weigh heavily on the share price eventually.
What We Can Learn From Hubei Huarong HoldingLtd's P/S?
Even after such a strong price drop, Hubei Huarong HoldingLtd's P/S still exceeds the industry median significantly. We'd say the price-to-sales ratio's power isn't primarily as a valuation instrument but rather to gauge current investor sentiment and future expectations.
Our examination of Hubei Huarong HoldingLtd revealed its poor three-year revenue trends aren't detracting from the P/S as much as we though, given they look worse than current industry expectations. When we see slower than industry revenue growth but an elevated P/S, there's considerable risk of the share price declining, sending the P/S lower. If recent medium-term revenue trends continue, it will place shareholders' investments at significant risk and potential investors in danger of paying an excessive premium.
We don't want to rain on the parade too much, but we did also find 3 warning signs for Hubei Huarong HoldingLtd (2 can't be ignored!) that you need to be mindful of.
If you're unsure about the strength of Hubei Huarong HoldingLtd's business, why not explore our interactive list of stocks with solid business fundamentals for some other companies you may have missed.
If you're looking to trade Hubei Huarong HoldingLtd, open an account with the lowest-cost platform trusted by professionals, Interactive Brokers.
With clients in over 200 countries and territories, and access to 160 markets, IBKR lets you trade stocks, options, futures, forex, bonds and funds from a single integrated account.
Enjoy no hidden fees, no account minimums, and FX conversion rates as low as 0.03%, far better than what most brokers offer.
Sponsored ContentValuation is complex, but we're here to simplify it.
Discover if Hubei Huarong HoldingLtd might be undervalued or overvalued with our detailed analysis, featuring fair value estimates, potential risks, dividends, insider trades, and its financial condition.
Access Free AnalysisHave feedback on this article? Concerned about the content? Get in touch with us directly. Alternatively, email editorial-team (at) simplywallst.com.
This article by Simply Wall St is general in nature. We provide commentary based on historical data and analyst forecasts only using an unbiased methodology and our articles are not intended to be financial advice. It does not constitute a recommendation to buy or sell any stock, and does not take account of your objectives, or your financial situation. We aim to bring you long-term focused analysis driven by fundamental data. Note that our analysis may not factor in the latest price-sensitive company announcements or qualitative material. Simply Wall St has no position in any stocks mentioned.
About SHSE:600421
Hubei Huarong HoldingLtd
Through its subsidiaries, provides molds, mold tables, and various tooling shelves for prefabricated concrete (PC) components used in housing construction application.
Low with imperfect balance sheet.
Market Insights

Community Narratives

