
Advertisement
- China
- /
- Auto Components
- /
- SZSE:300473
There's No Escaping Fuxin Dare Automotive Parts Co., Ltd.'s (SZSE:300473) Muted Revenues Despite A 26% Share Price Rise
Fuxin Dare Automotive Parts Co., Ltd. (SZSE:300473) shareholders would be excited to see that the share price has had a great month, posting a 26% gain and recovering from prior weakness. Notwithstanding the latest gain, the annual share price return of 3.2% isn't as impressive.
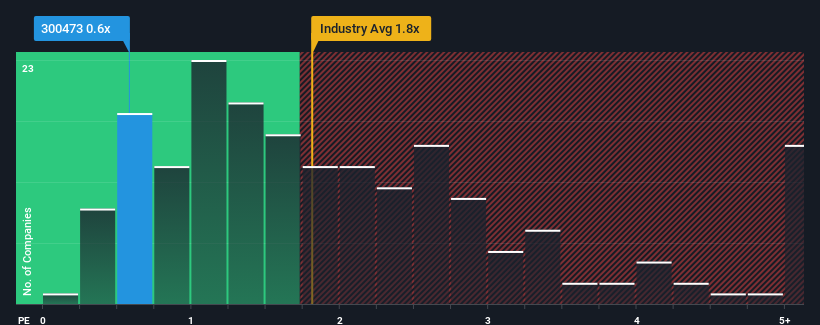
In spite of the firm bounce in price, given about half the companies operating in China's Auto Components industry have price-to-sales ratios (or "P/S") above 1.8x, you may still consider Fuxin Dare Automotive Parts as an attractive investment with its 0.6x P/S ratio. Nonetheless, we'd need to dig a little deeper to determine if there is a rational basis for the reduced P/S.
See our latest analysis for Fuxin Dare Automotive Parts
How Fuxin Dare Automotive Parts Has Been Performing
Revenue has risen at a steady rate over the last year for Fuxin Dare Automotive Parts, which is generally not a bad outcome. One possibility is that the P/S ratio is low because investors think this good revenue growth might actually underperform the broader industry in the near future. If you like the company, you'd be hoping this isn't the case so that you could potentially pick up some stock while it's out of favour.
We don't have analyst forecasts, but you can see how recent trends are setting up the company for the future by checking out our free report on Fuxin Dare Automotive Parts' earnings, revenue and cash flow.Do Revenue Forecasts Match The Low P/S Ratio?
Fuxin Dare Automotive Parts' P/S ratio would be typical for a company that's only expected to deliver limited growth, and importantly, perform worse than the industry.
Taking a look back first, we see that the company managed to grow revenues by a handy 3.0% last year. The latest three year period has also seen a 22% overall rise in revenue, aided somewhat by its short-term performance. Therefore, it's fair to say the revenue growth recently has been respectable for the company.
Comparing that to the industry, which is predicted to deliver 24% growth in the next 12 months, the company's momentum is weaker, based on recent medium-term annualised revenue results.
In light of this, it's understandable that Fuxin Dare Automotive Parts' P/S sits below the majority of other companies. Apparently many shareholders weren't comfortable holding on to something they believe will continue to trail the wider industry.
The Bottom Line On Fuxin Dare Automotive Parts' P/S
Despite Fuxin Dare Automotive Parts' share price climbing recently, its P/S still lags most other companies. While the price-to-sales ratio shouldn't be the defining factor in whether you buy a stock or not, it's quite a capable barometer of revenue expectations.
As we suspected, our examination of Fuxin Dare Automotive Parts revealed its three-year revenue trends are contributing to its low P/S, given they look worse than current industry expectations. Right now shareholders are accepting the low P/S as they concede future revenue probably won't provide any pleasant surprises. If recent medium-term revenue trends continue, it's hard to see the share price experience a reversal of fortunes anytime soon.
The company's balance sheet is another key area for risk analysis. Our free balance sheet analysis for Fuxin Dare Automotive Parts with six simple checks will allow you to discover any risks that could be an issue.
If these risks are making you reconsider your opinion on Fuxin Dare Automotive Parts, explore our interactive list of high quality stocks to get an idea of what else is out there.
New: AI Stock Screener & Alerts
Our new AI Stock Screener scans the market every day to uncover opportunities.
• Dividend Powerhouses (3%+ Yield)
• Undervalued Small Caps with Insider Buying
• High growth Tech and AI Companies
Or build your own from over 50 metrics.
Have feedback on this article? Concerned about the content? Get in touch with us directly. Alternatively, email editorial-team (at) simplywallst.com.
This article by Simply Wall St is general in nature. We provide commentary based on historical data and analyst forecasts only using an unbiased methodology and our articles are not intended to be financial advice. It does not constitute a recommendation to buy or sell any stock, and does not take account of your objectives, or your financial situation. We aim to bring you long-term focused analysis driven by fundamental data. Note that our analysis may not factor in the latest price-sensitive company announcements or qualitative material. Simply Wall St has no position in any stocks mentioned.
About SZSE:300473
Fuxin Dare Automotive Parts
Engages in the research, development, manufacture, and sale of automotive components in China and internationally.
Flawless balance sheet with proven track record.
Market Insights

Advertisement
Community Narratives
The company that turned a verb into a global necessity and basically runs the modern internet, digital ads, smartphones, maps, and AI.
Fair Value US$300.00|5.4% undervalued
OS
Community Contributor
Flowers Foods Pays A Fair Price For Health
Fair Value US$16.12|26.3% undervalued
NV
Community Contributor
TMX Group will thrive with 33.3% profit margin and enduring market moat
Fair Value CA$49.90|4.1% overvalued
LI
Community Contributor
The "Molecular Pencil": Why Beam's Technology is Built to Win
Fair Value US$65.01|62.7% undervalued
DA
Community Contributor