Stock Analysis
- China
- /
- Auto Components
- /
- SZSE:300432
Mianyang Fulin PrecisionLtd (SZSE:300432) pulls back 5.3% this week, but still delivers shareholders solid 25% CAGR over 5 years


When you buy shares in a company, it's worth keeping in mind the possibility that it could fail, and you could lose your money. But when you pick a company that is really flourishing, you can make more than 100%. For example, the Mianyang Fulin Precision Co.,Ltd. (SZSE:300432) share price has soared 199% in the last half decade. Most would be very happy with that. The last week saw the share price soften some 5.3%.
While this past week has detracted from the company's five-year return, let's look at the recent trends of the underlying business and see if the gains have been in alignment.
Check out our latest analysis for Mianyang Fulin PrecisionLtd
While Mianyang Fulin PrecisionLtd made a small profit, in the last year, we think that the market is probably more focussed on the top line growth at the moment. As a general rule, we think this kind of company is more comparable to loss-making stocks, since the actual profit is so low. For shareholders to have confidence a company will grow profits significantly, it must grow revenue.
For the last half decade, Mianyang Fulin PrecisionLtd can boast revenue growth at a rate of 37% per year. That's well above most pre-profit companies. Meanwhile, its share price performance certainly reflects the strong growth, given the share price grew at 25% per year, compound, during the period. So it seems likely that buyers have paid attention to the strong revenue growth. Mianyang Fulin PrecisionLtd seems like a high growth stock - so growth investors might want to add it to their watchlist.
You can see how earnings and revenue have changed over time in the image below (click on the chart to see the exact values).
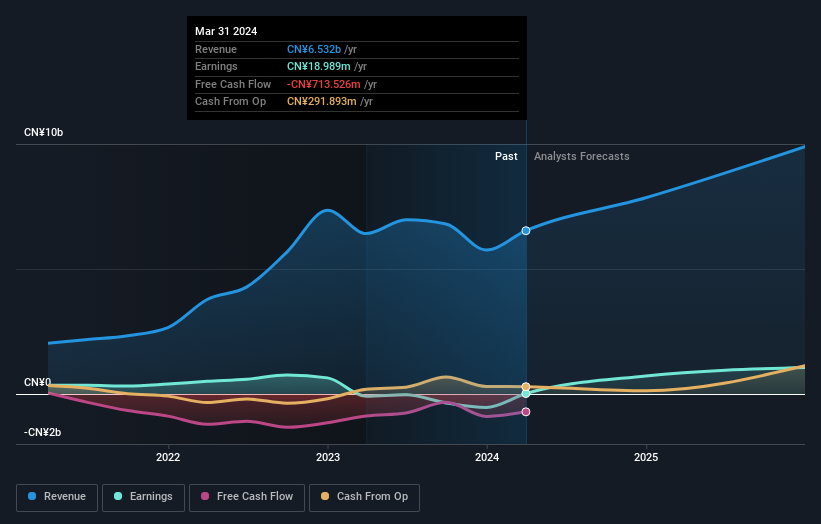
We know that Mianyang Fulin PrecisionLtd has improved its bottom line lately, but what does the future have in store? So it makes a lot of sense to check out what analysts think Mianyang Fulin PrecisionLtd will earn in the future (free profit forecasts).
What About The Total Shareholder Return (TSR)?
Investors should note that there's a difference between Mianyang Fulin PrecisionLtd's total shareholder return (TSR) and its share price change, which we've covered above. The TSR attempts to capture the value of dividends (as if they were reinvested) as well as any spin-offs or discounted capital raisings offered to shareholders. Mianyang Fulin PrecisionLtd's TSR of 205% for the 5 years exceeded its share price return, because it has paid dividends.
A Different Perspective
We regret to report that Mianyang Fulin PrecisionLtd shareholders are down 30% for the year. Unfortunately, that's worse than the broader market decline of 10%. Having said that, it's inevitable that some stocks will be oversold in a falling market. The key is to keep your eyes on the fundamental developments. On the bright side, long term shareholders have made money, with a gain of 25% per year over half a decade. It could be that the recent sell-off is an opportunity, so it may be worth checking the fundamental data for signs of a long term growth trend. While it is well worth considering the different impacts that market conditions can have on the share price, there are other factors that are even more important. Consider for instance, the ever-present spectre of investment risk. We've identified 1 warning sign with Mianyang Fulin PrecisionLtd , and understanding them should be part of your investment process.
If you like to buy stocks alongside management, then you might just love this free list of companies. (Hint: many of them are unnoticed AND have attractive valuation).
Please note, the market returns quoted in this article reflect the market weighted average returns of stocks that currently trade on Chinese exchanges.
Valuation is complex, but we're helping make it simple.
Find out whether Mianyang Fulin PrecisionLtd is potentially over or undervalued by checking out our comprehensive analysis, which includes fair value estimates, risks and warnings, dividends, insider transactions and financial health.
View the Free AnalysisHave feedback on this article? Concerned about the content? Get in touch with us directly. Alternatively, email editorial-team (at) simplywallst.com.
This article by Simply Wall St is general in nature. We provide commentary based on historical data and analyst forecasts only using an unbiased methodology and our articles are not intended to be financial advice. It does not constitute a recommendation to buy or sell any stock, and does not take account of your objectives, or your financial situation. We aim to bring you long-term focused analysis driven by fundamental data. Note that our analysis may not factor in the latest price-sensitive company announcements or qualitative material. Simply Wall St has no position in any stocks mentioned.
About SZSE:300432
Mianyang Fulin PrecisionLtd
Engages in the research and development, manufacture, and sale of automotive engine parts in China.
Adequate balance sheet and slightly overvalued.
