- China
- /
- Auto Components
- /
- SZSE:002284
Slowing Rates Of Return At Zhejiang Asia-Pacific Mechanical & ElectronicLtd (SZSE:002284) Leave Little Room For Excitement


If you're not sure where to start when looking for the next multi-bagger, there are a few key trends you should keep an eye out for. Ideally, a business will show two trends; firstly a growing return on capital employed (ROCE) and secondly, an increasing amount of capital employed. Put simply, these types of businesses are compounding machines, meaning they are continually reinvesting their earnings at ever-higher rates of return. In light of that, when we looked at Zhejiang Asia-Pacific Mechanical & ElectronicLtd (SZSE:002284) and its ROCE trend, we weren't exactly thrilled.
What Is Return On Capital Employed (ROCE)?
For those who don't know, ROCE is a measure of a company's yearly pre-tax profit (its return), relative to the capital employed in the business. To calculate this metric for Zhejiang Asia-Pacific Mechanical & ElectronicLtd, this is the formula:
Return on Capital Employed = Earnings Before Interest and Tax (EBIT) ÷ (Total Assets - Current Liabilities)
0.027 = CN¥79m ÷ (CN¥6.8b - CN¥3.8b) (Based on the trailing twelve months to September 2023).
So, Zhejiang Asia-Pacific Mechanical & ElectronicLtd has an ROCE of 2.7%. Ultimately, that's a low return and it under-performs the Auto Components industry average of 6.6%.
Check out our latest analysis for Zhejiang Asia-Pacific Mechanical & ElectronicLtd
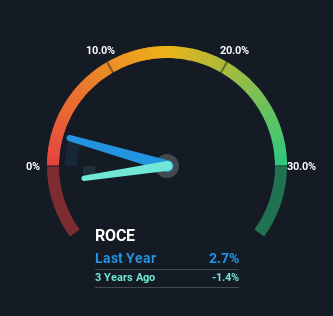
While the past is not representative of the future, it can be helpful to know how a company has performed historically, which is why we have this chart above. If you'd like to look at how Zhejiang Asia-Pacific Mechanical & ElectronicLtd has performed in the past in other metrics, you can view this free graph of Zhejiang Asia-Pacific Mechanical & ElectronicLtd's past earnings, revenue and cash flow.
What Does the ROCE Trend For Zhejiang Asia-Pacific Mechanical & ElectronicLtd Tell Us?
We're a bit concerned with the trends, because the business is applying 22% less capital than it was five years ago and returns on that capital have stayed flat. To us that doesn't look like a multi-bagger because the company appears to be selling assets and it's returns aren't increasing. In addition to that, since the ROCE doesn't scream "quality" at 2.7%, it's hard to get excited about these developments.
On another note, while the change in ROCE trend might not scream for attention, it's interesting that the current liabilities have actually gone up over the last five years. This is intriguing because if current liabilities hadn't increased to 56% of total assets, this reported ROCE would probably be less than2.7% because total capital employed would be higher.The 2.7% ROCE could be even lower if current liabilities weren't 56% of total assets, because the the formula would show a larger base of total capital employed. Additionally, this high level of current liabilities isn't ideal because it means the company's suppliers (or short-term creditors) are effectively funding a large portion of the business.
The Bottom Line On Zhejiang Asia-Pacific Mechanical & ElectronicLtd's ROCE
In summary, Zhejiang Asia-Pacific Mechanical & ElectronicLtd isn't reinvesting funds back into the business and returns aren't growing. And investors may be recognizing these trends since the stock has only returned a total of 14% to shareholders over the last five years. So if you're looking for a multi-bagger, the underlying trends indicate you may have better chances elsewhere.
Like most companies, Zhejiang Asia-Pacific Mechanical & ElectronicLtd does come with some risks, and we've found 1 warning sign that you should be aware of.
While Zhejiang Asia-Pacific Mechanical & ElectronicLtd isn't earning the highest return, check out this free list of companies that are earning high returns on equity with solid balance sheets.
Valuation is complex, but we're here to simplify it.
Discover if Zhejiang Asia-Pacific Mechanical & ElectronicLtd might be undervalued or overvalued with our detailed analysis, featuring fair value estimates, potential risks, dividends, insider trades, and its financial condition.
Access Free AnalysisHave feedback on this article? Concerned about the content? Get in touch with us directly. Alternatively, email editorial-team (at) simplywallst.com.
This article by Simply Wall St is general in nature. We provide commentary based on historical data and analyst forecasts only using an unbiased methodology and our articles are not intended to be financial advice. It does not constitute a recommendation to buy or sell any stock, and does not take account of your objectives, or your financial situation. We aim to bring you long-term focused analysis driven by fundamental data. Note that our analysis may not factor in the latest price-sensitive company announcements or qualitative material. Simply Wall St has no position in any stocks mentioned.
About SZSE:002284
Zhejiang Asia-Pacific Mechanical & ElectronicLtd
Engages in the development, production, and sale of automotive parts in China and internationally.
Flawless balance sheet with solid track record.
Market Insights

Community Narratives

