
Advertisement
- China
- /
- Auto Components
- /
- SZSE:002196
Zhejiang Founder Motor Co., Ltd. (SZSE:002196) Stock Rockets 30% But Many Are Still Ignoring The Company

Zhejiang Founder Motor Co., Ltd. (SZSE:002196) shareholders are no doubt pleased to see that the share price has bounced 30% in the last month, although it is still struggling to make up recently lost ground. Not all shareholders will be feeling jubilant, since the share price is still down a very disappointing 31% in the last twelve months.
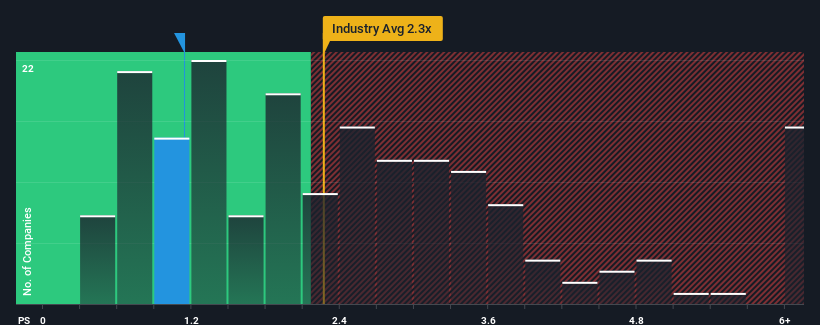
Even after such a large jump in price, it would still be understandable if you think Zhejiang Founder Motor is a stock with good investment prospects with a price-to-sales ratios (or "P/S") of 1.1x, considering almost half the companies in China's Auto Components industry have P/S ratios above 2.3x. Nonetheless, we'd need to dig a little deeper to determine if there is a rational basis for the reduced P/S.
Check out our latest analysis for Zhejiang Founder Motor
How Has Zhejiang Founder Motor Performed Recently?
We'd have to say that with no tangible growth over the last year, Zhejiang Founder Motor's revenue has been unimpressive. One possibility is that the P/S is low because investors think this benign revenue growth rate will likely underperform the broader industry in the near future. If not, then existing shareholders may be feeling optimistic about the future direction of the share price.
Want the full picture on earnings, revenue and cash flow for the company? Then our free report on Zhejiang Founder Motor will help you shine a light on its historical performance.How Is Zhejiang Founder Motor's Revenue Growth Trending?
There's an inherent assumption that a company should underperform the industry for P/S ratios like Zhejiang Founder Motor's to be considered reasonable.
Taking a look back first, we see that there was hardly any revenue growth to speak of for the company over the past year. Although pleasingly revenue has lifted 125% in aggregate from three years ago, notwithstanding the last 12 months. So while the company has done a solid job in the past, it's somewhat concerning to see revenue growth decline as much as it has.
Comparing that to the industry, which is only predicted to deliver 25% growth in the next 12 months, the company's momentum is stronger based on recent medium-term annualised revenue results.
With this information, we find it odd that Zhejiang Founder Motor is trading at a P/S lower than the industry. Apparently some shareholders believe the recent performance has exceeded its limits and have been accepting significantly lower selling prices.
The Key Takeaway
The latest share price surge wasn't enough to lift Zhejiang Founder Motor's P/S close to the industry median. We'd say the price-to-sales ratio's power isn't primarily as a valuation instrument but rather to gauge current investor sentiment and future expectations.
We're very surprised to see Zhejiang Founder Motor currently trading on a much lower than expected P/S since its recent three-year growth is higher than the wider industry forecast. When we see robust revenue growth that outpaces the industry, we presume that there are notable underlying risks to the company's future performance, which is exerting downward pressure on the P/S ratio. At least price risks look to be very low if recent medium-term revenue trends continue, but investors seem to think future revenue could see a lot of volatility.
The company's balance sheet is another key area for risk analysis. You can assess many of the main risks through our free balance sheet analysis for Zhejiang Founder Motor with six simple checks.
If strong companies turning a profit tickle your fancy, then you'll want to check out this free list of interesting companies that trade on a low P/E (but have proven they can grow earnings).
Valuation is complex, but we're here to simplify it.
Discover if Zhejiang Founder Motor might be undervalued or overvalued with our detailed analysis, featuring fair value estimates, potential risks, dividends, insider trades, and its financial condition.
Access Free AnalysisHave feedback on this article? Concerned about the content? Get in touch with us directly. Alternatively, email editorial-team (at) simplywallst.com.
This article by Simply Wall St is general in nature. We provide commentary based on historical data and analyst forecasts only using an unbiased methodology and our articles are not intended to be financial advice. It does not constitute a recommendation to buy or sell any stock, and does not take account of your objectives, or your financial situation. We aim to bring you long-term focused analysis driven by fundamental data. Note that our analysis may not factor in the latest price-sensitive company announcements or qualitative material. Simply Wall St has no position in any stocks mentioned.
About SZSE:002196
Adequate balance sheet and slightly overvalued.
Market Insights

Advertisement
Community Narratives

BMW cruising ahead with new EVs and premium models to boost revenue 5%
Fair Value €135.07|45.0% undervalued
UN
Community Contributor
EU#2 - From Humble Beginnings to Global Powerhouse
Fair Value DKK 851.04|47.8% undervalued
TO
Community Contributor