
Advertisement
- China
- /
- Auto Components
- /
- SZSE:002126
Return Trends At Zhejiang Yinlun MachineryLtd (SZSE:002126) Aren't Appealing
If we want to find a potential multi-bagger, often there are underlying trends that can provide clues. Amongst other things, we'll want to see two things; firstly, a growing return on capital employed (ROCE) and secondly, an expansion in the company's amount of capital employed. Basically this means that a company has profitable initiatives that it can continue to reinvest in, which is a trait of a compounding machine. However, after investigating Zhejiang Yinlun MachineryLtd (SZSE:002126), we don't think it's current trends fit the mold of a multi-bagger.
What Is Return On Capital Employed (ROCE)?
If you haven't worked with ROCE before, it measures the 'return' (pre-tax profit) a company generates from capital employed in its business. Analysts use this formula to calculate it for Zhejiang Yinlun MachineryLtd:
Return on Capital Employed = Earnings Before Interest and Tax (EBIT) ÷ (Total Assets - Current Liabilities)
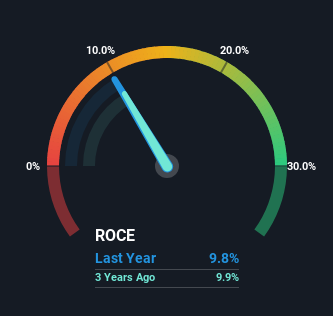
0.098 = CN¥696m ÷ (CN¥16b - CN¥8.8b) (Based on the trailing twelve months to September 2023).
So, Zhejiang Yinlun MachineryLtd has an ROCE of 9.8%. On its own that's a low return, but compared to the average of 5.9% generated by the Auto Components industry, it's much better.
See our latest analysis for Zhejiang Yinlun MachineryLtd
In the above chart we have measured Zhejiang Yinlun MachineryLtd's prior ROCE against its prior performance, but the future is arguably more important. If you'd like to see what analysts are forecasting going forward, you should check out our free analyst report for Zhejiang Yinlun MachineryLtd .
What The Trend Of ROCE Can Tell Us
The returns on capital haven't changed much for Zhejiang Yinlun MachineryLtd in recent years. The company has consistently earned 9.8% for the last five years, and the capital employed within the business has risen 68% in that time. This poor ROCE doesn't inspire confidence right now, and with the increase in capital employed, it's evident that the business isn't deploying the funds into high return investments.
On a separate but related note, it's important to know that Zhejiang Yinlun MachineryLtd has a current liabilities to total assets ratio of 55%, which we'd consider pretty high. This effectively means that suppliers (or short-term creditors) are funding a large portion of the business, so just be aware that this can introduce some elements of risk. Ideally we'd like to see this reduce as that would mean fewer obligations bearing risks.
The Bottom Line
As we've seen above, Zhejiang Yinlun MachineryLtd's returns on capital haven't increased but it is reinvesting in the business. Yet to long term shareholders the stock has gifted them an incredible 104% return in the last five years, so the market appears to be rosy about its future. But if the trajectory of these underlying trends continue, we think the likelihood of it being a multi-bagger from here isn't high.
If you're still interested in Zhejiang Yinlun MachineryLtd it's worth checking out our FREE intrinsic value approximation for 002126 to see if it's trading at an attractive price in other respects.
If you want to search for solid companies with great earnings, check out this free list of companies with good balance sheets and impressive returns on equity.
Valuation is complex, but we're here to simplify it.
Discover if Zhejiang Yinlun MachineryLtd might be undervalued or overvalued with our detailed analysis, featuring fair value estimates, potential risks, dividends, insider trades, and its financial condition.
Access Free AnalysisHave feedback on this article? Concerned about the content? Get in touch with us directly. Alternatively, email editorial-team (at) simplywallst.com.
This article by Simply Wall St is general in nature. We provide commentary based on historical data and analyst forecasts only using an unbiased methodology and our articles are not intended to be financial advice. It does not constitute a recommendation to buy or sell any stock, and does not take account of your objectives, or your financial situation. We aim to bring you long-term focused analysis driven by fundamental data. Note that our analysis may not factor in the latest price-sensitive company announcements or qualitative material. Simply Wall St has no position in any stocks mentioned.
About SZSE:002126
Zhejiang Yinlun MachineryLtd
Engages in the research and development, manufacturing, and sale of various thermal management and exhaust gas post-treatment products.
Excellent balance sheet average dividend payer.
Similar Companies
Market Insights

Advertisement
Community Narratives
The "Molecular Pencil": Why Beam's Technology is Built to Win
Fair Value US$65.01|65.4% undervalued
DA
Community Contributor
The silent giant behind virtually every advanced chip powering AI, smartphones, and modern infrastructure.
Fair Value US$310.00|6.1% undervalued
OS
Community Contributor
ADP Stock: Solid Fundamentals, But AI Investments Test Its Margin Resilience
Fair Value US$387.77|34.2% undervalued
YI
Community Contributor
MINISO's fair value is projected at 26.69 with an anticipated PE ratio shift of 20x
Fair Value US$24.03|9.6% undervalued
BE
Community Contributor