- China
- /
- Auto Components
- /
- SHSE:603786
KEBODA TECHNOLOGY Co., Ltd.'s (SHSE:603786) Fundamentals Look Pretty Strong: Could The Market Be Wrong About The Stock?

KEBODA TECHNOLOGY (SHSE:603786) has had a rough three months with its share price down 9.1%. However, stock prices are usually driven by a company’s financial performance over the long term, which in this case looks quite promising. Particularly, we will be paying attention to KEBODA TECHNOLOGY's ROE today.
ROE or return on equity is a useful tool to assess how effectively a company can generate returns on the investment it received from its shareholders. Simply put, it is used to assess the profitability of a company in relation to its equity capital.
Check out our latest analysis for KEBODA TECHNOLOGY
How Is ROE Calculated?
Return on equity can be calculated by using the formula:
Return on Equity = Net Profit (from continuing operations) ÷ Shareholders' Equity
So, based on the above formula, the ROE for KEBODA TECHNOLOGY is:
15% = CN¥803m ÷ CN¥5.2b (Based on the trailing twelve months to September 2024).
The 'return' is the profit over the last twelve months. That means that for every CN¥1 worth of shareholders' equity, the company generated CN¥0.15 in profit.
What Is The Relationship Between ROE And Earnings Growth?
Thus far, we have learned that ROE measures how efficiently a company is generating its profits. Based on how much of its profits the company chooses to reinvest or "retain", we are then able to evaluate a company's future ability to generate profits. Assuming everything else remains unchanged, the higher the ROE and profit retention, the higher the growth rate of a company compared to companies that don't necessarily bear these characteristics.
KEBODA TECHNOLOGY's Earnings Growth And 15% ROE
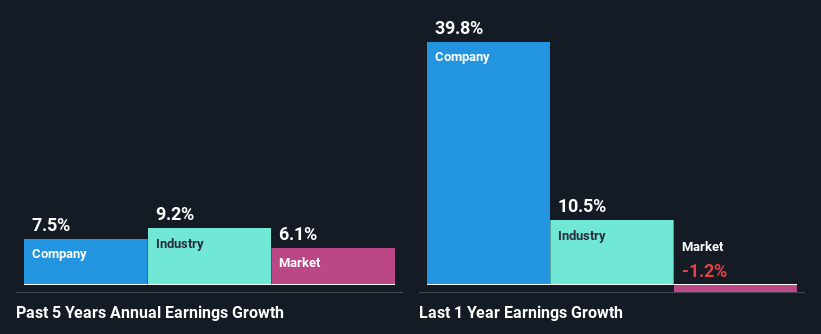
To begin with, KEBODA TECHNOLOGY seems to have a respectable ROE. Further, the company's ROE compares quite favorably to the industry average of 8.3%. This probably laid the ground for KEBODA TECHNOLOGY's moderate 7.5% net income growth seen over the past five years.
We then performed a comparison between KEBODA TECHNOLOGY's net income growth with the industry, which revealed that the company's growth is similar to the average industry growth of 9.2% in the same 5-year period.
Earnings growth is an important metric to consider when valuing a stock. What investors need to determine next is if the expected earnings growth, or the lack of it, is already built into the share price. This then helps them determine if the stock is placed for a bright or bleak future. One good indicator of expected earnings growth is the P/E ratio which determines the price the market is willing to pay for a stock based on its earnings prospects. So, you may want to check if KEBODA TECHNOLOGY is trading on a high P/E or a low P/E, relative to its industry.
Is KEBODA TECHNOLOGY Using Its Retained Earnings Effectively?
With a three-year median payout ratio of 41% (implying that the company retains 59% of its profits), it seems that KEBODA TECHNOLOGY is reinvesting efficiently in a way that it sees respectable amount growth in its earnings and pays a dividend that's well covered.
Besides, KEBODA TECHNOLOGY has been paying dividends over a period of five years. This shows that the company is committed to sharing profits with its shareholders.
Conclusion
On the whole, we feel that KEBODA TECHNOLOGY's performance has been quite good. Particularly, we like that the company is reinvesting heavily into its business, and at a high rate of return. Unsurprisingly, this has led to an impressive earnings growth. That being so, the latest analyst forecasts show that the company will continue to see an expansion in its earnings. Are these analysts expectations based on the broad expectations for the industry, or on the company's fundamentals? Click here to be taken to our analyst's forecasts page for the company.
Mobile Infrastructure for Defense and Disaster
The next wave in robotics isn't humanoid. Its fully autonomous towers delivering 5G, ISR, and radar in under 30 minutes, anywhere.
Get the investor briefing before the next round of contracts
Sponsored On Behalf of CiTechValuation is complex, but we're here to simplify it.
Discover if KEBODA TECHNOLOGY might be undervalued or overvalued with our detailed analysis, featuring fair value estimates, potential risks, dividends, insider trades, and its financial condition.
Access Free AnalysisHave feedback on this article? Concerned about the content? Get in touch with us directly. Alternatively, email editorial-team (at) simplywallst.com.
This article by Simply Wall St is general in nature. We provide commentary based on historical data and analyst forecasts only using an unbiased methodology and our articles are not intended to be financial advice. It does not constitute a recommendation to buy or sell any stock, and does not take account of your objectives, or your financial situation. We aim to bring you long-term focused analysis driven by fundamental data. Note that our analysis may not factor in the latest price-sensitive company announcements or qualitative material. Simply Wall St has no position in any stocks mentioned.
About SHSE:603786
KEBODA TECHNOLOGY
KEBODA TECHNOLOGY Co., Ltd. manufacture and sale of automotive electronics and related products for automotive industry in China.
Solid track record with excellent balance sheet.
Market Insights

Weekly Picks

Early mover in a fast growing industry. Likely to experience share price volatility as they scale


A case for CA$31.80 (undiluted), aka 8,616% upside from CA$0.37 (an 86 bagger!).


Moderation and Stabilisation: HOLD: Fair Price based on a 4-year Cycle is $12.08
Recently Updated Narratives


Title: Market Sentiment Is Dead Wrong — Here's Why PSEC Deserves a Second Look


An amazing opportunity to potentially get a 100 bagger

Amazon: Why the World’s Biggest Platform Still Runs on Invisible Economics
Popular Narratives


Crazy Undervalued 42 Baggers Silver Play (Active & Running Mine)


MicroVision will explode future revenue by 380.37% with a vision towards success


NVDA: Expanding AI Demand Will Drive Major Data Center Investments Through 2026
Trending Discussion
