
Advertisement
- China
- /
- Auto Components
- /
- SHSE:601058
Declining Stock and Solid Fundamentals: Is The Market Wrong About Sailun Group Co., Ltd. (SHSE:601058)?

Sailun Group (SHSE:601058) has had a rough three months with its share price down 21%. However, a closer look at its sound financials might cause you to think again. Given that fundamentals usually drive long-term market outcomes, the company is worth looking at. In this article, we decided to focus on Sailun Group's ROE.
Return on equity or ROE is an important factor to be considered by a shareholder because it tells them how effectively their capital is being reinvested. Put another way, it reveals the company's success at turning shareholder investments into profits.
View our latest analysis for Sailun Group
How Is ROE Calculated?
Return on equity can be calculated by using the formula:
Return on Equity = Net Profit (from continuing operations) ÷ Shareholders' Equity
So, based on the above formula, the ROE for Sailun Group is:
23% = CN¥4.3b ÷ CN¥18b (Based on the trailing twelve months to June 2024).
The 'return' is the yearly profit. So, this means that for every CN¥1 of its shareholder's investments, the company generates a profit of CN¥0.23.
Why Is ROE Important For Earnings Growth?
So far, we've learned that ROE is a measure of a company's profitability. Depending on how much of these profits the company reinvests or "retains", and how effectively it does so, we are then able to assess a company’s earnings growth potential. Generally speaking, other things being equal, firms with a high return on equity and profit retention, have a higher growth rate than firms that don’t share these attributes.
Sailun Group's Earnings Growth And 23% ROE
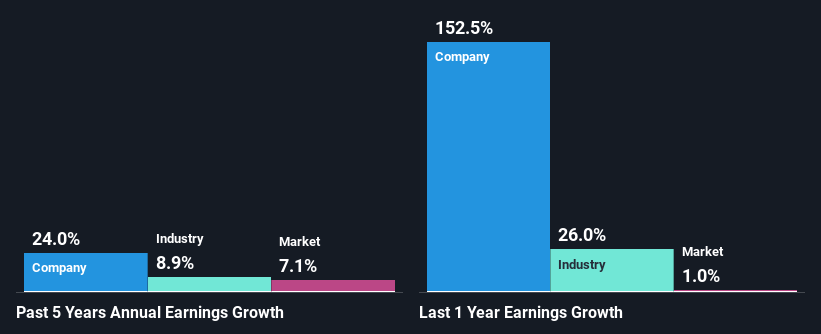
First thing first, we like that Sailun Group has an impressive ROE. Second, a comparison with the average ROE reported by the industry of 8.2% also doesn't go unnoticed by us. Under the circumstances, Sailun Group's considerable five year net income growth of 24% was to be expected.
As a next step, we compared Sailun Group's net income growth with the industry, and pleasingly, we found that the growth seen by the company is higher than the average industry growth of 8.9%.
Earnings growth is a huge factor in stock valuation. What investors need to determine next is if the expected earnings growth, or the lack of it, is already built into the share price. This then helps them determine if the stock is placed for a bright or bleak future. One good indicator of expected earnings growth is the P/E ratio which determines the price the market is willing to pay for a stock based on its earnings prospects. So, you may want to check if Sailun Group is trading on a high P/E or a low P/E, relative to its industry.
Is Sailun Group Making Efficient Use Of Its Profits?
The three-year median payout ratio for Sailun Group is 30%, which is moderately low. The company is retaining the remaining 70%. So it seems that Sailun Group is reinvesting efficiently in a way that it sees impressive growth in its earnings (discussed above) and pays a dividend that's well covered.
Besides, Sailun Group has been paying dividends for at least ten years or more. This shows that the company is committed to sharing profits with its shareholders. Existing analyst estimates suggest that the company's future payout ratio is expected to drop to 16% over the next three years. Regardless, the ROE is not expected to change much for the company despite the lower expected payout ratio.
Conclusion
In total, we are pretty happy with Sailun Group's performance. In particular, it's great to see that the company is investing heavily into its business and along with a high rate of return, that has resulted in a sizeable growth in its earnings. With that said, the latest industry analyst forecasts reveal that the company's earnings growth is expected to slow down. To know more about the company's future earnings growth forecasts take a look at this free report on analyst forecasts for the company to find out more.
New: Manage All Your Stock Portfolios in One Place
We've created the ultimate portfolio companion for stock investors, and it's free.
• Connect an unlimited number of Portfolios and see your total in one currency
• Be alerted to new Warning Signs or Risks via email or mobile
• Track the Fair Value of your stocks
Have feedback on this article? Concerned about the content? Get in touch with us directly. Alternatively, email editorial-team (at) simplywallst.com.
This article by Simply Wall St is general in nature. We provide commentary based on historical data and analyst forecasts only using an unbiased methodology and our articles are not intended to be financial advice. It does not constitute a recommendation to buy or sell any stock, and does not take account of your objectives, or your financial situation. We aim to bring you long-term focused analysis driven by fundamental data. Note that our analysis may not factor in the latest price-sensitive company announcements or qualitative material. Simply Wall St has no position in any stocks mentioned.
About SHSE:601058
Sailun Group
Engages in the research and development, production, sale, and servicing of tires in China, Europe, the United States, Asia, and Africa.
Excellent balance sheet established dividend payer.
Market Insights


Advertisement
Community Narratives
For the Emperor: Why Games Workshop Could Be a Star Investment
Fair Value UK£160.00|0.5% overvalued
RO
Community Contributor
Securitas will boost margins with AI and tech-driven services
Fair Value SEK 260.91|44.9% undervalued
UN
Community Contributor
A Leader in EV Charging with Growth Potential
Fair Value €27.00|21.3% undervalued
TI
Community Contributor