- China
- /
- Auto Components
- /
- SHSE:600741
HUAYU Automotive Systems Company Limited's (SHSE:600741) Intrinsic Value Is Potentially 50% Above Its Share Price


Key Insights
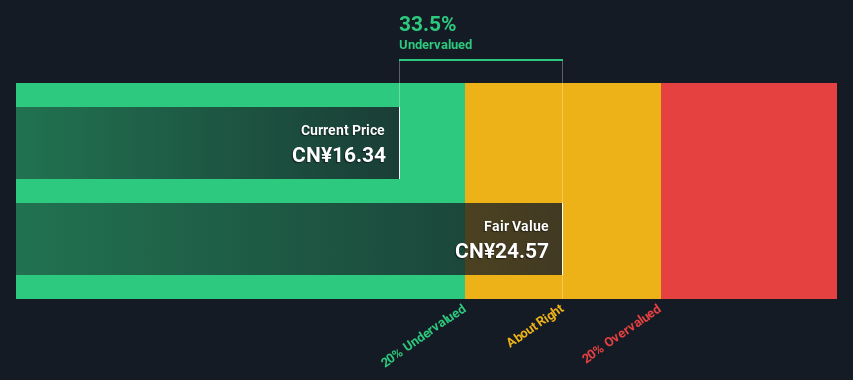
- HUAYU Automotive Systems' estimated fair value is CN¥24.57 based on 2 Stage Free Cash Flow to Equity
- Current share price of CN¥16.34 suggests HUAYU Automotive Systems is potentially 34% undervalued
- The CN¥20.86 analyst price target for 600741 is 15% less than our estimate of fair value
Today we'll do a simple run through of a valuation method used to estimate the attractiveness of HUAYU Automotive Systems Company Limited (SHSE:600741) as an investment opportunity by estimating the company's future cash flows and discounting them to their present value. This will be done using the Discounted Cash Flow (DCF) model. Believe it or not, it's not too difficult to follow, as you'll see from our example!
We would caution that there are many ways of valuing a company and, like the DCF, each technique has advantages and disadvantages in certain scenarios. Anyone interested in learning a bit more about intrinsic value should have a read of the Simply Wall St analysis model.
Check out our latest analysis for HUAYU Automotive Systems
The Model
We use what is known as a 2-stage model, which simply means we have two different periods of growth rates for the company's cash flows. Generally the first stage is higher growth, and the second stage is a lower growth phase. To start off with, we need to estimate the next ten years of cash flows. Where possible we use analyst estimates, but when these aren't available we extrapolate the previous free cash flow (FCF) from the last estimate or reported value. We assume companies with shrinking free cash flow will slow their rate of shrinkage, and that companies with growing free cash flow will see their growth rate slow, over this period. We do this to reflect that growth tends to slow more in the early years than it does in later years.
A DCF is all about the idea that a dollar in the future is less valuable than a dollar today, and so the sum of these future cash flows is then discounted to today's value:
10-year free cash flow (FCF) forecast
| 2024 | 2025 | 2026 | 2027 | 2028 | 2029 | 2030 | 2031 | 2032 | 2033 | |
| Levered FCF (CN¥, Millions) | CN¥5.21b | CN¥5.86b | CN¥6.70b | CN¥6.89b | CN¥7.09b | CN¥7.29b | CN¥7.51b | CN¥7.72b | CN¥7.95b | CN¥8.18b |
| Growth Rate Estimate Source | Analyst x1 | Analyst x1 | Analyst x1 | Est @ 2.88% | Est @ 2.89% | Est @ 2.89% | Est @ 2.89% | Est @ 2.90% | Est @ 2.90% | Est @ 2.90% |
| Present Value (CN¥, Millions) Discounted @ 11% | CN¥4.7k | CN¥4.8k | CN¥4.9k | CN¥4.6k | CN¥4.2k | CN¥3.9k | CN¥3.6k | CN¥3.4k | CN¥3.1k | CN¥2.9k |
("Est" = FCF growth rate estimated by Simply Wall St)
Present Value of 10-year Cash Flow (PVCF) = CN¥40b
The second stage is also known as Terminal Value, this is the business's cash flow after the first stage. For a number of reasons a very conservative growth rate is used that cannot exceed that of a country's GDP growth. In this case we have used the 5-year average of the 10-year government bond yield (2.9%) to estimate future growth. In the same way as with the 10-year 'growth' period, we discount future cash flows to today's value, using a cost of equity of 11%.
Terminal Value (TV)= FCF2033 × (1 + g) ÷ (r – g) = CN¥8.2b× (1 + 2.9%) ÷ (11%– 2.9%) = CN¥105b
Present Value of Terminal Value (PVTV)= TV / (1 + r)10= CN¥105b÷ ( 1 + 11%)10= CN¥37b
The total value is the sum of cash flows for the next ten years plus the discounted terminal value, which results in the Total Equity Value, which in this case is CN¥77b. In the final step we divide the equity value by the number of shares outstanding. Compared to the current share price of CN¥16.3, the company appears quite undervalued at a 34% discount to where the stock price trades currently. Valuations are imprecise instruments though, rather like a telescope - move a few degrees and end up in a different galaxy. Do keep this in mind.
The Assumptions
We would point out that the most important inputs to a discounted cash flow are the discount rate and of course the actual cash flows. Part of investing is coming up with your own evaluation of a company's future performance, so try the calculation yourself and check your own assumptions. The DCF also does not consider the possible cyclicality of an industry, or a company's future capital requirements, so it does not give a full picture of a company's potential performance. Given that we are looking at HUAYU Automotive Systems as potential shareholders, the cost of equity is used as the discount rate, rather than the cost of capital (or weighted average cost of capital, WACC) which accounts for debt. In this calculation we've used 11%, which is based on a levered beta of 1.422. Beta is a measure of a stock's volatility, compared to the market as a whole. We get our beta from the industry average beta of globally comparable companies, with an imposed limit between 0.8 and 2.0, which is a reasonable range for a stable business.
SWOT Analysis for HUAYU Automotive Systems
- Debt is not viewed as a risk.
- Dividends are covered by earnings and cash flows.
- Dividend is in the top 25% of dividend payers in the market.
- Earnings growth over the past year underperformed the Auto Components industry.
- Good value based on P/E ratio and estimated fair value.
- Annual earnings are forecast to decline for the next 3 years.
Next Steps:
Whilst important, the DCF calculation ideally won't be the sole piece of analysis you scrutinize for a company. DCF models are not the be-all and end-all of investment valuation. Instead the best use for a DCF model is to test certain assumptions and theories to see if they would lead to the company being undervalued or overvalued. For example, changes in the company's cost of equity or the risk free rate can significantly impact the valuation. Can we work out why the company is trading at a discount to intrinsic value? For HUAYU Automotive Systems, we've put together three further factors you should assess:
- Risks: Case in point, we've spotted 2 warning signs for HUAYU Automotive Systems you should be aware of, and 1 of them makes us a bit uncomfortable.
- Future Earnings: How does 600741's growth rate compare to its peers and the wider market? Dig deeper into the analyst consensus number for the upcoming years by interacting with our free analyst growth expectation chart.
- Other High Quality Alternatives: Do you like a good all-rounder? Explore our interactive list of high quality stocks to get an idea of what else is out there you may be missing!
PS. Simply Wall St updates its DCF calculation for every Chinese stock every day, so if you want to find the intrinsic value of any other stock just search here.
If you're looking to trade HUAYU Automotive Systems, open an account with the lowest-cost platform trusted by professionals, Interactive Brokers.
With clients in over 200 countries and territories, and access to 160 markets, IBKR lets you trade stocks, options, futures, forex, bonds and funds from a single integrated account.
Enjoy no hidden fees, no account minimums, and FX conversion rates as low as 0.03%, far better than what most brokers offer.
Sponsored ContentValuation is complex, but we're here to simplify it.
Discover if HUAYU Automotive Systems might be undervalued or overvalued with our detailed analysis, featuring fair value estimates, potential risks, dividends, insider trades, and its financial condition.
Access Free AnalysisHave feedback on this article? Concerned about the content? Get in touch with us directly. Alternatively, email editorial-team (at) simplywallst.com.
This article by Simply Wall St is general in nature. We provide commentary based on historical data and analyst forecasts only using an unbiased methodology and our articles are not intended to be financial advice. It does not constitute a recommendation to buy or sell any stock, and does not take account of your objectives, or your financial situation. We aim to bring you long-term focused analysis driven by fundamental data. Note that our analysis may not factor in the latest price-sensitive company announcements or qualitative material. Simply Wall St has no position in any stocks mentioned.
About SHSE:600741
HUAYU Automotive Systems
Researches and develops, manufactures, and sells automotive parts worldwide.
6 star dividend payer and undervalued.
Similar Companies
Market Insights

Community Narratives

