
Advertisement
- China
- /
- Auto Components
- /
- SHSE:600615
Investors Appear Satisfied With Chongqing Fenghwa Group Co., Ltd.'s (SHSE:600615) Prospects As Shares Rocket 26%
Chongqing Fenghwa Group Co., Ltd. (SHSE:600615) shareholders are no doubt pleased to see that the share price has bounced 26% in the last month, although it is still struggling to make up recently lost ground. While recent buyers may be laughing, long-term holders might not be as pleased since the recent gain only brings the stock back to where it started a year ago.
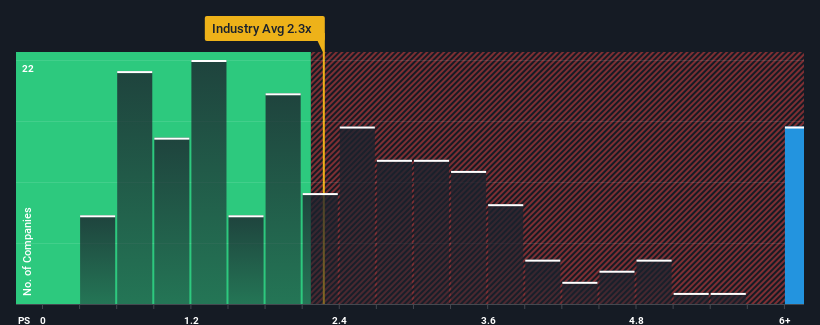
Following the firm bounce in price, you could be forgiven for thinking Chongqing Fenghwa Group is a stock to steer clear of with a price-to-sales ratios (or "P/S") of 13.6x, considering almost half the companies in China's Auto Components industry have P/S ratios below 2.3x. Nonetheless, we'd need to dig a little deeper to determine if there is a rational basis for the highly elevated P/S.
See our latest analysis for Chongqing Fenghwa Group
What Does Chongqing Fenghwa Group's P/S Mean For Shareholders?
For example, consider that Chongqing Fenghwa Group's financial performance has been poor lately as its revenue has been in decline. One possibility is that the P/S is high because investors think the company will still do enough to outperform the broader industry in the near future. You'd really hope so, otherwise you're paying a pretty hefty price for no particular reason.
We don't have analyst forecasts, but you can see how recent trends are setting up the company for the future by checking out our free report on Chongqing Fenghwa Group's earnings, revenue and cash flow.Do Revenue Forecasts Match The High P/S Ratio?
In order to justify its P/S ratio, Chongqing Fenghwa Group would need to produce outstanding growth that's well in excess of the industry.
Retrospectively, the last year delivered a frustrating 33% decrease to the company's top line. Even so, admirably revenue has lifted 118% in aggregate from three years ago, notwithstanding the last 12 months. So we can start by confirming that the company has generally done a very good job of growing revenue over that time, even though it had some hiccups along the way.
Comparing that to the industry, which is only predicted to deliver 25% growth in the next 12 months, the company's momentum is stronger based on recent medium-term annualised revenue results.
With this in consideration, it's not hard to understand why Chongqing Fenghwa Group's P/S is high relative to its industry peers. Presumably shareholders aren't keen to offload something they believe will continue to outmanoeuvre the wider industry.
The Bottom Line On Chongqing Fenghwa Group's P/S
Shares in Chongqing Fenghwa Group have seen a strong upwards swing lately, which has really helped boost its P/S figure. Typically, we'd caution against reading too much into price-to-sales ratios when settling on investment decisions, though it can reveal plenty about what other market participants think about the company.
As we suspected, our examination of Chongqing Fenghwa Group revealed its three-year revenue trends are contributing to its high P/S, given they look better than current industry expectations. In the eyes of shareholders, the probability of a continued growth trajectory is great enough to prevent the P/S from pulling back. If recent medium-term revenue trends continue, it's hard to see the share price falling strongly in the near future under these circumstances.
You always need to take note of risks, for example - Chongqing Fenghwa Group has 1 warning sign we think you should be aware of.
It's important to make sure you look for a great company, not just the first idea you come across. So if growing profitability aligns with your idea of a great company, take a peek at this free list of interesting companies with strong recent earnings growth (and a low P/E).
New: AI Stock Screener & Alerts
Our new AI Stock Screener scans the market every day to uncover opportunities.
• Dividend Powerhouses (3%+ Yield)
• Undervalued Small Caps with Insider Buying
• High growth Tech and AI Companies
Or build your own from over 50 metrics.
Have feedback on this article? Concerned about the content? Get in touch with us directly. Alternatively, email editorial-team (at) simplywallst.com.
This article by Simply Wall St is general in nature. We provide commentary based on historical data and analyst forecasts only using an unbiased methodology and our articles are not intended to be financial advice. It does not constitute a recommendation to buy or sell any stock, and does not take account of your objectives, or your financial situation. We aim to bring you long-term focused analysis driven by fundamental data. Note that our analysis may not factor in the latest price-sensitive company announcements or qualitative material. Simply Wall St has no position in any stocks mentioned.
About SHSE:600615
Chongqing Fenghwa Group
Through its subsidiary, manufactures and sells magnesium and aluminum metal auto parts in China.
Excellent balance sheet with proven track record.
Market Insights

Advertisement
Community Narratives
Quality at a Premium. A time to watch, not to buy?
Fair Value US$154.56|29.3% undervalued
DA
Community Contributor
GRAB: The Super-App at the Heart of Southeast Asia’s Digital Boom
Fair Value US$6.60|7.0% undervalued
BL
Community Contributor
Verve Group to Surge with 51.61% Revenue Growth
Fair Value €6.00|65.0% undervalued
ME
Community Contributor
100% Patient Improvement in trial puts this $16M Biotech on the radar
Fair Value US$5.30|65.7% undervalued
JO
Community Contributor