
Advertisement
- China
- /
- Auto Components
- /
- SHSE:600609
Shenyang Jinbei Automotive (SHSE:600609) Will Be Hoping To Turn Its Returns On Capital Around
If you're not sure where to start when looking for the next multi-bagger, there are a few key trends you should keep an eye out for. One common approach is to try and find a company with returns on capital employed (ROCE) that are increasing, in conjunction with a growing amount of capital employed. If you see this, it typically means it's a company with a great business model and plenty of profitable reinvestment opportunities. Having said that, from a first glance at Shenyang Jinbei Automotive (SHSE:600609) we aren't jumping out of our chairs at how returns are trending, but let's have a deeper look.
Return On Capital Employed (ROCE): What Is It?
For those who don't know, ROCE is a measure of a company's yearly pre-tax profit (its return), relative to the capital employed in the business. The formula for this calculation on Shenyang Jinbei Automotive is:
Return on Capital Employed = Earnings Before Interest and Tax (EBIT) ÷ (Total Assets - Current Liabilities)
0.17 = CN¥281m ÷ (CN¥3.9b - CN¥2.2b) (Based on the trailing twelve months to March 2024).
Thus, Shenyang Jinbei Automotive has an ROCE of 17%. In absolute terms, that's a satisfactory return, but compared to the Auto Components industry average of 6.9% it's much better.
See our latest analysis for Shenyang Jinbei Automotive
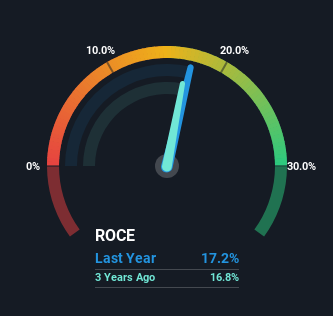
Historical performance is a great place to start when researching a stock so above you can see the gauge for Shenyang Jinbei Automotive's ROCE against it's prior returns. If you'd like to look at how Shenyang Jinbei Automotive has performed in the past in other metrics, you can view this free graph of Shenyang Jinbei Automotive's past earnings, revenue and cash flow.
How Are Returns Trending?
When we looked at the ROCE trend at Shenyang Jinbei Automotive, we didn't gain much confidence. Around five years ago the returns on capital were 33%, but since then they've fallen to 17%. And considering revenue has dropped while employing more capital, we'd be cautious. This could mean that the business is losing its competitive advantage or market share, because while more money is being put into ventures, it's actually producing a lower return - "less bang for their buck" per se.
On a side note, Shenyang Jinbei Automotive has done well to pay down its current liabilities to 58% of total assets. That could partly explain why the ROCE has dropped. What's more, this can reduce some aspects of risk to the business because now the company's suppliers or short-term creditors are funding less of its operations. Some would claim this reduces the business' efficiency at generating ROCE since it is now funding more of the operations with its own money. Keep in mind 58% is still pretty high, so those risks are still somewhat prevalent.
The Bottom Line On Shenyang Jinbei Automotive's ROCE
From the above analysis, we find it rather worrisome that returns on capital and sales for Shenyang Jinbei Automotive have fallen, meanwhile the business is employing more capital than it was five years ago. Despite the concerning underlying trends, the stock has actually gained 2.1% over the last five years, so it might be that the investors are expecting the trends to reverse. Regardless, we don't like the trends as they are and if they persist, we think you might find better investments elsewhere.
If you're still interested in Shenyang Jinbei Automotive it's worth checking out our FREE intrinsic value approximation for 600609 to see if it's trading at an attractive price in other respects.
While Shenyang Jinbei Automotive may not currently earn the highest returns, we've compiled a list of companies that currently earn more than 25% return on equity. Check out this free list here.
New: Manage All Your Stock Portfolios in One Place
We've created the ultimate portfolio companion for stock investors, and it's free.
• Connect an unlimited number of Portfolios and see your total in one currency
• Be alerted to new Warning Signs or Risks via email or mobile
• Track the Fair Value of your stocks
Have feedback on this article? Concerned about the content? Get in touch with us directly. Alternatively, email editorial-team (at) simplywallst.com.
This article by Simply Wall St is general in nature. We provide commentary based on historical data and analyst forecasts only using an unbiased methodology and our articles are not intended to be financial advice. It does not constitute a recommendation to buy or sell any stock, and does not take account of your objectives, or your financial situation. We aim to bring you long-term focused analysis driven by fundamental data. Note that our analysis may not factor in the latest price-sensitive company announcements or qualitative material. Simply Wall St has no position in any stocks mentioned.
About SHSE:600609
Shenyang Jinbei Automotive
Engages in the design, production, and sale of auto parts in China.
Flawless balance sheet with proven track record.
Market Insights

Advertisement
Community Narratives
MicroVision will explode future revenue by 380.37% with a vision towards success
Fair Value US$60|98.4% undervalued
TH
Community Contributor
The Indispensable Artery for a New North American Economy
Fair Value CA$132.87|0.7% overvalued
TI
Community Contributor
Recently Updated Narratives
CO

composite32 on Astor Enerji ·
Astor Enerji will surge with a fair value of $140.43 in the next 3 years
Fair Value:₺140.4335.5% undervalued
1 followerusers have followed this narrative
0 commentsusers have commented on this narrative
0 likesusers have liked this narrative
RE

RecMag on Proximus ·
Proximus: The State-Backed Backup Plan with 7% Gross Yield and 15% Currency Upside.
Fair Value:€17.1356.7% undervalued
30 followersusers have followed this narrative
0 commentsusers have commented on this narrative
0 likesusers have liked this narrative
AG


Agricola on IMPACT Silver ·
A case for for IMPACT Silver Corp (TSXV:IPT) to reach USD $4.52 (CAD $6.16) in 2026 (23 bagger in 1 year) and USD $5.76 (CAD $7.89) by 2030
Fair Value:CA$7.8996.2% undervalued
1 followerusers have followed this narrative
0 commentsusers have commented on this narrative
0 likesusers have liked this narrative
Popular Narratives
TH

TheWallstreetKing on MicroVision ·
MicroVision will explode future revenue by 380.37% with a vision towards success
Fair Value:US$6098.4% undervalued
101 followersusers have followed this narrative
10 commentsusers have commented on this narrative
20 likesusers have liked this narrative
OS


oscargarcia on Alphabet ·
The company that turned a verb into a global necessity and basically runs the modern internet, digital ads, smartphones, maps, and AI.
Fair Value:US$3405.8% undervalued
138 followersusers have followed this narrative
6 commentsusers have commented on this narrative
18 likesusers have liked this narrative
AN


AnalystConsensusTarget on NVIDIA ·
NVDA: Expanding AI Demand Will Drive Major Data Center Investments Through 2026
Fair Value:US$250.3929.3% undervalued
929 followersusers have followed this narrative
6 commentsusers have commented on this narrative
23 likesusers have liked this narrative