
Advertisement
- Chile
- /
- Telecom Services and Carriers
- /
- SNSE:CTC
Here's What Telefónica Chile S.A.'s (SNSE:CTC) P/E Ratio Is Telling Us

Today, we'll introduce the concept of the P/E ratio for those who are learning about investing. We'll show how you can use Telefónica Chile S.A.'s (SNSE:CTC) P/E ratio to inform your assessment of the investment opportunity. What is Telefónica Chile's P/E ratio? Well, based on the last twelve months it is 12.48. That means that at current prices, buyers pay CLP12.48 for every CLP1 in trailing yearly profits.
See our latest analysis for Telefónica Chile
How Do I Calculate Telefónica Chile's Price To Earnings Ratio?
The formula for price to earnings is:
Price to Earnings Ratio = Price per Share ÷ Earnings per Share (EPS)
Or for Telefónica Chile:
P/E of 12.48 = CLP380.000 ÷ CLP30.451 (Based on the year to December 2019.)
(Note: the above calculation results may not be precise due to rounding.)
Is A High Price-to-Earnings Ratio Good?
A higher P/E ratio implies that investors pay a higher price for the earning power of the business. That isn't necessarily good or bad, but a high P/E implies relatively high expectations of what a company can achieve in the future.
Does Telefónica Chile Have A Relatively High Or Low P/E For Its Industry?
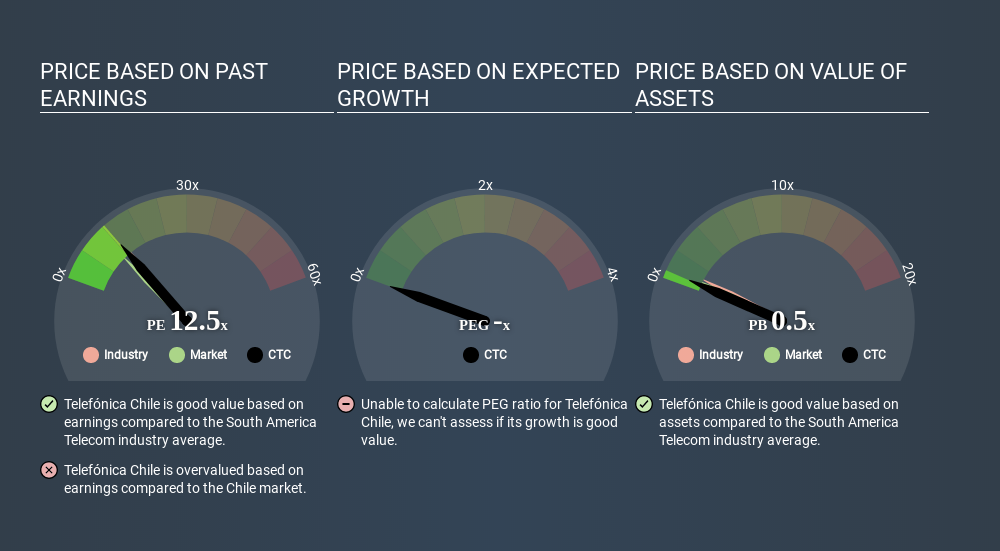
We can get an indication of market expectations by looking at the P/E ratio. You can see in the image below that the average P/E (13.1) for companies in the telecom industry is roughly the same as Telefónica Chile's P/E.
Its P/E ratio suggests that Telefónica Chile shareholders think that in the future it will perform about the same as other companies in its industry classification. If the company has better than average prospects, then the market might be underestimating it. I would further inform my view by checking insider buying and selling., among other things.
How Growth Rates Impact P/E Ratios
P/E ratios primarily reflect market expectations around earnings growth rates. When earnings grow, the 'E' increases, over time. That means unless the share price increases, the P/E will reduce in a few years. A lower P/E should indicate the stock is cheap relative to others -- and that may attract buyers.
Telefónica Chile's earnings made like a rocket, taking off 97% last year. Having said that, if we look back three years, EPS growth has averaged a comparatively less impressive 14%. Regrettably, the longer term performance is poor, with EPS down 5.8% per year over 5 years.
A Limitation: P/E Ratios Ignore Debt and Cash In The Bank
One drawback of using a P/E ratio is that it considers market capitalization, but not the balance sheet. That means it doesn't take debt or cash into account. Theoretically, a business can improve its earnings (and produce a lower P/E in the future) by investing in growth. That means taking on debt (or spending its cash).
Such expenditure might be good or bad, in the long term, but the point here is that the balance sheet is not reflected by this ratio.
Telefónica Chile's Balance Sheet
Telefónica Chile's net debt is considerable, at 102% of its market cap. If you want to compare its P/E ratio to other companies, you must keep in mind that these debt levels would usually warrant a relatively low P/E.
The Bottom Line On Telefónica Chile's P/E Ratio
Telefónica Chile trades on a P/E ratio of 12.5, which is above its market average of 10.8. Its meaningful level of debt should warrant a lower P/E ratio, but the fast EPS growth is a positive. So it seems likely the market is overlooking the debt because of the fast earnings growth.
Investors have an opportunity when market expectations about a stock are wrong. People often underestimate remarkable growth -- so investors can make money when fast growth is not fully appreciated. So this free visual report on analyst forecasts could hold the key to an excellent investment decision.
Of course you might be able to find a better stock than Telefónica Chile. So you may wish to see this free collection of other companies that have grown earnings strongly.
If you spot an error that warrants correction, please contact the editor at editorial-team@simplywallst.com. This article by Simply Wall St is general in nature. It does not constitute a recommendation to buy or sell any stock, and does not take account of your objectives, or your financial situation. Simply Wall St has no position in the stocks mentioned.
We aim to bring you long-term focused research analysis driven by fundamental data. Note that our analysis may not factor in the latest price-sensitive company announcements or qualitative material. Thank you for reading.
About SNSE:CTC
Excellent balance sheet and slightly overvalued.
Similar Companies
Market Insights


Advertisement
Community Narratives
For the Emperor: Why Games Workshop Could Be a Star Investment
Fair Value UK£160.00|0.1% overvalued
RO
Community Contributor
Securitas will boost margins with AI and tech-driven services
Fair Value SEK 260.91|44.5% undervalued
UN
Community Contributor
A Leader in EV Charging with Growth Potential
Fair Value €27.00|20.9% undervalued
TI
Community Contributor