

If you're looking for a multi-bagger, there's a few things to keep an eye out for. Firstly, we'd want to identify a growing return on capital employed (ROCE) and then alongside that, an ever-increasing base of capital employed. Ultimately, this demonstrates that it's a business that is reinvesting profits at increasing rates of return. With that in mind, the ROCE of Paz (SNSE:PAZ) looks decent, right now, so lets see what the trend of returns can tell us.
Return On Capital Employed (ROCE): What Is It?
For those that aren't sure what ROCE is, it measures the amount of pre-tax profits a company can generate from the capital employed in its business. The formula for this calculation on Paz is:
Return on Capital Employed = Earnings Before Interest and Tax (EBIT) ÷ (Total Assets - Current Liabilities)
0.10 = CL$39b ÷ (CL$692b - CL$309b) (Based on the trailing twelve months to March 2023).
Thus, Paz has an ROCE of 10%. In absolute terms, that's a pretty normal return, and it's somewhat close to the Consumer Durables industry average of 9.1%.
Check out our latest analysis for Paz
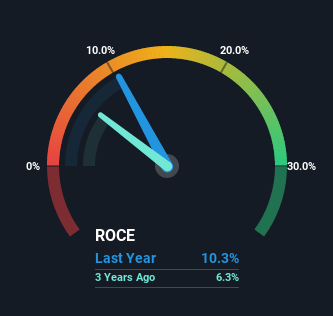
Historical performance is a great place to start when researching a stock so above you can see the gauge for Paz's ROCE against it's prior returns. If you'd like to look at how Paz has performed in the past in other metrics, you can view this free graph of past earnings, revenue and cash flow.
SWOT Analysis for Paz
- Earnings growth over the past year exceeded the industry.
- Debt is well covered by earnings.
- Dividend is low compared to the top 25% of dividend payers in the Consumer Durables market.
- Current share price is above our estimate of fair value.
- PAZ's financial characteristics indicate limited near-term opportunities for shareholders.
- Lack of analyst coverage makes it difficult to determine PAZ's earnings prospects.
- Debt is not well covered by operating cash flow.
- Paying a dividend but company has no free cash flows.
What Can We Tell From Paz's ROCE Trend?
The trend of ROCE doesn't stand out much, but returns on a whole are decent. Over the past five years, ROCE has remained relatively flat at around 10% and the business has deployed 35% more capital into its operations. 10% is a pretty standard return, and it provides some comfort knowing that Paz has consistently earned this amount. Stable returns in this ballpark can be unexciting, but if they can be maintained over the long run, they often provide nice rewards to shareholders.
On another note, while the change in ROCE trend might not scream for attention, it's interesting that the current liabilities have actually gone up over the last five years. This is intriguing because if current liabilities hadn't increased to 45% of total assets, this reported ROCE would probably be less than10% because total capital employed would be higher.The 10% ROCE could be even lower if current liabilities weren't 45% of total assets, because the the formula would show a larger base of total capital employed. So with current liabilities at such high levels, this effectively means the likes of suppliers or short-term creditors are funding a meaningful part of the business, which in some instances can bring some risks.
Our Take On Paz's ROCE
To sum it up, Paz has simply been reinvesting capital steadily, at those decent rates of return. However, despite the favorable fundamentals, the stock has fallen 34% over the last five years, so there might be an opportunity here for astute investors. That's why we think it'd be worthwhile to look further into this stock given the fundamentals are appealing.
One final note, you should learn about the 2 warning signs we've spotted with Paz (including 1 which makes us a bit uncomfortable) .
For those who like to invest in solid companies, check out this free list of companies with solid balance sheets and high returns on equity.
New: Manage All Your Stock Portfolios in One Place
We've created the ultimate portfolio companion for stock investors, and it's free.
• Connect an unlimited number of Portfolios and see your total in one currency
• Be alerted to new Warning Signs or Risks via email or mobile
• Track the Fair Value of your stocks
Have feedback on this article? Concerned about the content? Get in touch with us directly. Alternatively, email editorial-team (at) simplywallst.com.
This article by Simply Wall St is general in nature. We provide commentary based on historical data and analyst forecasts only using an unbiased methodology and our articles are not intended to be financial advice. It does not constitute a recommendation to buy or sell any stock, and does not take account of your objectives, or your financial situation. We aim to bring you long-term focused analysis driven by fundamental data. Note that our analysis may not factor in the latest price-sensitive company announcements or qualitative material. Simply Wall St has no position in any stocks mentioned.
About SNSE:PAZ
Paz
A real estate company, engages in housing projects development business in Chile and Peru.
Mediocre balance sheet second-rate dividend payer.
Similar Companies
Market Insights

Community Narratives


