Advertisement
- Switzerland
- /
- Telecom Services and Carriers
- /
- SWX:SCMN
Swisscom (SWX:SCMN): Assessing Valuation as Nine-Month Results Show Higher Sales but Lower Earnings

Simply Wall St
Reviewed by Simply Wall St
Swisscom (SWX:SCMN) released its earnings for the first nine months of 2025, reporting higher sales compared to the prior year while net income and basic earnings per share slipped. This mix of results is catching investor attention.
See our latest analysis for Swisscom.
Swisscom’s recent financial update has added a bit of uncertainty to its momentum, but the bigger picture looks resilient. The 1-year total shareholder return sits at an impressive 18.44%, and the stock’s double-digit year-to-date share price gain suggests long-term investors are still being rewarded, even as the latest results prompt a pause for breath.
If Swisscom’s moves have you thinking about what else is worth watching, now could be a smart time to discover fast growing stocks with high insider ownership
The mixed financial picture raises the real question: Is Swisscom’s current share price reflecting all the future growth the market expects, or could today’s numbers signal a genuine buying opportunity?
Price-to-Earnings of 24.2x: Is it justified?
Swisscom is trading at a price-to-earnings (P/E) ratio of 24.2x, which stands out as high compared to both its peers and the broader industry. With a last close price of CHF582, the stock commands a premium on earnings relative to its sector.
The price-to-earnings ratio indicates how much investors are willing to pay per franc of earnings, serving as a quick temperature check for market expectations. In established sectors like telecom, a higher P/E can sometimes reflect expectations of steady, not rapid, future growth or a perceived premium for stability.
At 24.2x, Swisscom is priced well above the average for its peers (19x) and the broader European telecom industry (16.7x). This suggests the market is attributing considerably more value to Swisscom’s earning potential, despite its recent challenges with declining profit margins and profit growth. If the market consensus on sector growth or earnings forecasts shifts, there could be reversion toward these peer averages.
See what the numbers say about this price — find out in our valuation breakdown.
Result: Price-to-Earnings of 24.2x (OVERVALUED)
However, Swisscom faces headwinds from slowing revenue growth and a recent share price trading above analyst targets. Both of these factors could challenge continued outperformance.
Find out about the key risks to this Swisscom narrative.
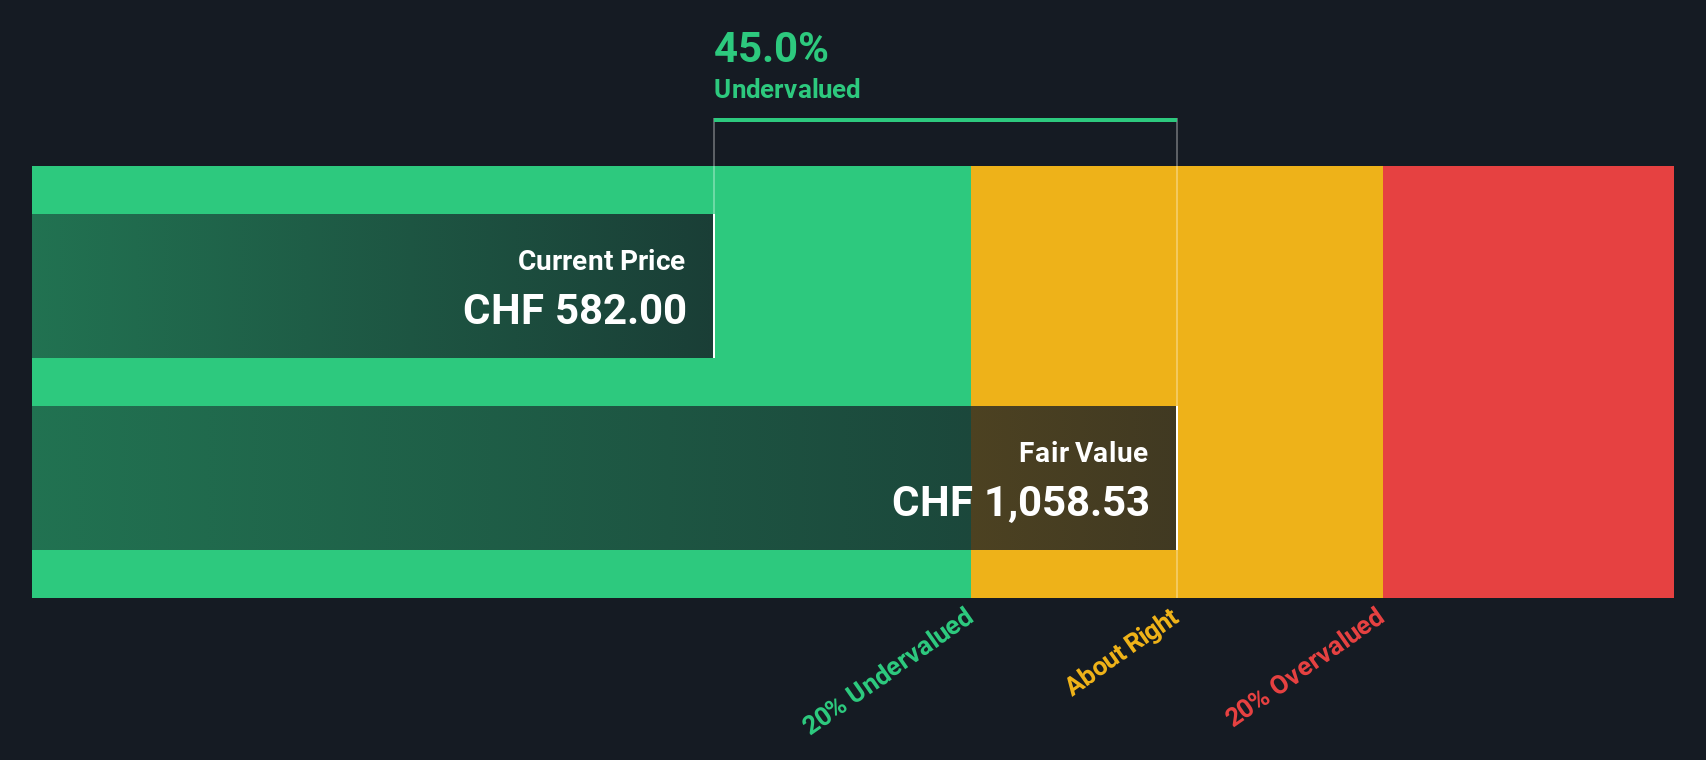
Another View: Discounted Cash Flow Suggests Undervaluation
While Swisscom’s price-to-earnings ratio appears overvalued compared to peers, our SWS DCF model tells a different story. Based on projected future cash flows, Swisscom’s current share price is trading about 45% below the estimated fair value. This sharp contrast raises a key question for investors: is the market underestimating the company’s long-term cash generation?
Look into how the SWS DCF model arrives at its fair value.
Simply Wall St performs a discounted cash flow (DCF) on every stock in the world every day (check out Swisscom for example). We show the entire calculation in full. You can track the result in your watchlist or portfolio and be alerted when this changes, or use our stock screener to discover 876 undervalued stocks based on their cash flows. If you save a screener we even alert you when new companies match - so you never miss a potential opportunity.
Build Your Own Swisscom Narrative
If you see things differently or prefer to draw your own conclusions, it’s easy to dive into the numbers and build your unique perspective in just minutes. Do it your way
A great starting point for your Swisscom research is our analysis highlighting 2 key rewards and 3 important warning signs that could impact your investment decision.
Looking for more investment ideas?
Make sure you stay ahead of the curve by using the Simply Wall St Screener for fresh investment opportunities you don’t want to overlook.
- Target stable income by checking out these 15 dividend stocks with yields > 3%, which features proven yields above 3% and histories of consistent payouts.
- Capitalize on cutting-edge innovation by focusing your search on these 26 AI penny stocks, which are driven by artificial intelligence breakthroughs and rapid adoption across industries.
- Grow your portfolio with excellent value by tracking these 876 undervalued stocks based on cash flows, offering strong cash flow prospects that the market may have overlooked.
This article by Simply Wall St is general in nature. We provide commentary based on historical data and analyst forecasts only using an unbiased methodology and our articles are not intended to be financial advice. It does not constitute a recommendation to buy or sell any stock, and does not take account of your objectives, or your financial situation. We aim to bring you long-term focused analysis driven by fundamental data. Note that our analysis may not factor in the latest price-sensitive company announcements or qualitative material. Simply Wall St has no position in any stocks mentioned.
New: Manage All Your Stock Portfolios in One Place
We've created the ultimate portfolio companion for stock investors, and it's free.
• Connect an unlimited number of Portfolios and see your total in one currency
• Be alerted to new Warning Signs or Risks via email or mobile
• Track the Fair Value of your stocks
Have feedback on this article? Concerned about the content? Get in touch with us directly. Alternatively, email editorial-team@simplywallst.com
About SWX:SCMN
Swisscom
Provides telecommunication services primarily in Switzerland, Italy, and internationally.
Second-rate dividend payer with low risk.
Similar Companies
Market Insights

Advertisement
Community Narratives
MINISO's fair value is projected at 26.69 with an anticipated PE ratio shift of 20x
Fair Value US$24.03|11.4% undervalued
BE
Community Contributor
Procter & Gamble: A Dividend Giant Facing Slowing Growth
Fair Value US$119.81|23.5% overvalued
AN
Community Contributor
Eli Lilly's Future Growth Driven by Tirzepatide and Favorable Market Conditions
Fair Value US$1.19k|14.0% undervalued
EA
Community Contributor