Advertisement
- Switzerland
- /
- Semiconductors
- /
- SWX:AMS
A Look at ams-OSRAM (SWX:AMS) Valuation After Latest Laser and Automotive Lighting Innovations

Simply Wall St
Reviewed by Simply Wall St
ams-OSRAM (SWX:AMS) has rolled out new high-performance laser and LED technologies, including a 5-junction edge-emitting laser for lidar and the PLPM7 Vegalas laser for projection. These advancements bolster its leadership in automotive lighting.
See our latest analysis for ams-OSRAM.
ams-OSRAM’s recent rollout of advanced laser and LED technologies came at a time when momentum in its stock price has been noticeable. After a standout year-to-date share price return of 66.8%, the past month saw some cooling with an 8.3% dip. Recent innovations and a robust position in automotive lighting seem to affirm its longer-term growth narrative. While the total shareholder return over the past year is an impressive 63.5%, the multiyear view remains a reminder of previous challenges, with total shareholder returns still well below earlier peaks.
If ams-OSRAM’s push into cutting-edge vehicle lighting has you watching the sector, take the next step and discover See the full list for free.
With so much innovation hitting the market and shares still far from their historic highs, should investors view ams-OSRAM as undervalued, or is the optimism already reflected in the current price?
Price-to-Sales of 0.3x: Is it justified?
ams-OSRAM is currently trading at a price-to-sales ratio of 0.3x, which signals significant undervaluation compared to its peers and industry. With the last close at CHF10.5, the market appears to be pricing the shares well below the sector norm.
The price-to-sales ratio compares a company's market capitalization to its total annual sales and helps investors gauge how much they are paying for each unit of revenue. For a technology and semiconductor company like ams-OSRAM, this multiple is especially relevant given the industry's focus on top-line growth during periods of heavy investment or unprofitability.
Trading at just 0.3x sales, ams-OSRAM’s valuation stands out. Peers in Europe average 5.5x and the wider semiconductor sector sits at 2.2x. Even against an estimated fair ratio of 0.7x, ams-OSRAM looks low. The stock’s discounted valuation could signal deep market skepticism or indicate a potential catch-up if revenue trends play out as anticipated.
Explore the SWS fair ratio for ams-OSRAM
Result: Price-to-Sales of 0.3x (UNDERVALUED)
However, lingering concerns around persistent net losses and slow revenue growth could limit upside, particularly if industry conditions become more challenging.
Find out about the key risks to this ams-OSRAM narrative.
Another View: The SWS DCF Model
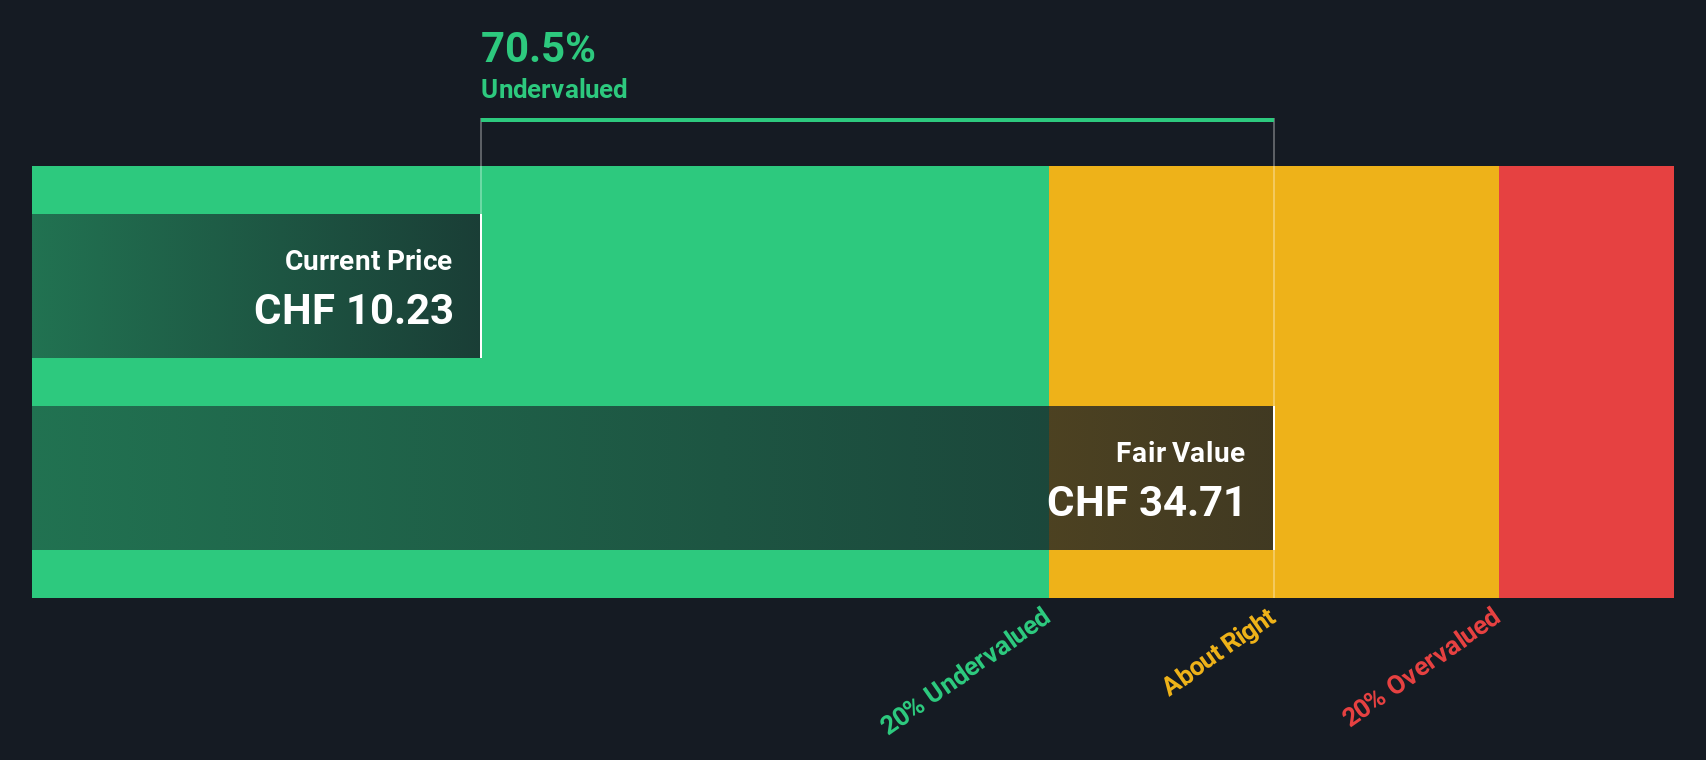
While ams-OSRAM’s price-to-sales ratio paints a picture of deep value, our DCF model offers a strikingly similar result. The SWS DCF model estimates fair value at CHF34.56, which is far above the current share price. This suggests even more pronounced undervaluation. Could market skepticism be overdone, or is there something being missed?
Look into how the SWS DCF model arrives at its fair value.
Simply Wall St performs a discounted cash flow (DCF) on every stock in the world every day (check out ams-OSRAM for example). We show the entire calculation in full. You can track the result in your watchlist or portfolio and be alerted when this changes, or use our stock screener to discover 865 undervalued stocks based on their cash flows. If you save a screener we even alert you when new companies match - so you never miss a potential opportunity.
Build Your Own ams-OSRAM Narrative
If these conclusions don’t match your outlook or you’d like to examine the numbers on your own terms, you can assemble a personalized view in minutes, Do it your way
A great starting point for your ams-OSRAM research is our analysis highlighting 3 key rewards and 1 important warning sign that could impact your investment decision.
Looking for more investment ideas?
Don’t wait on the sidelines while the next opportunities emerge. Find companies with upside and fresh potential using these actionable investing shortcuts below.
- Uncover growth potential by scanning these 25 AI penny stocks, which are shaping breakthroughs in artificial intelligence and redefining entire industries.
- Build your portfolio’s staying power by capitalizing on income opportunities with these 14 dividend stocks with yields > 3%, featuring companies that pay reliable yields above 3%.
- Seize prime value moments by using these 865 undervalued stocks based on cash flows to pinpoint quality stocks trading at appealing cash flow-based valuations.
This article by Simply Wall St is general in nature. We provide commentary based on historical data and analyst forecasts only using an unbiased methodology and our articles are not intended to be financial advice. It does not constitute a recommendation to buy or sell any stock, and does not take account of your objectives, or your financial situation. We aim to bring you long-term focused analysis driven by fundamental data. Note that our analysis may not factor in the latest price-sensitive company announcements or qualitative material. Simply Wall St has no position in any stocks mentioned.
New: AI Stock Screener & Alerts
Our new AI Stock Screener scans the market every day to uncover opportunities.
• Dividend Powerhouses (3%+ Yield)
• Undervalued Small Caps with Insider Buying
• High growth Tech and AI Companies
Or build your own from over 50 metrics.
Have feedback on this article? Concerned about the content? Get in touch with us directly. Alternatively, email editorial-team@simplywallst.com
About SWX:AMS
ams-OSRAM
Engages in the design, manufacture, and sale of LED and optical sensor solutions in Europe, the Middle East, Africa, the Americas, and the Asia/Pacific.
Undervalued with reasonable growth potential.
Market Insights

Advertisement
Community Narratives
MINISO's fair value is projected at 26.69 with an anticipated PE ratio shift of 20x
Fair Value US$24.03|9.0% undervalued
BE
Community Contributor
Procter & Gamble: A Dividend Giant Facing Slowing Growth
Fair Value US$119.81|23.5% overvalued
AN
Community Contributor
Eli Lilly's Future Growth Driven by Tirzepatide and Favorable Market Conditions
Fair Value US$1.19k|14.4% undervalued
EA
Community Contributor