
Advertisement
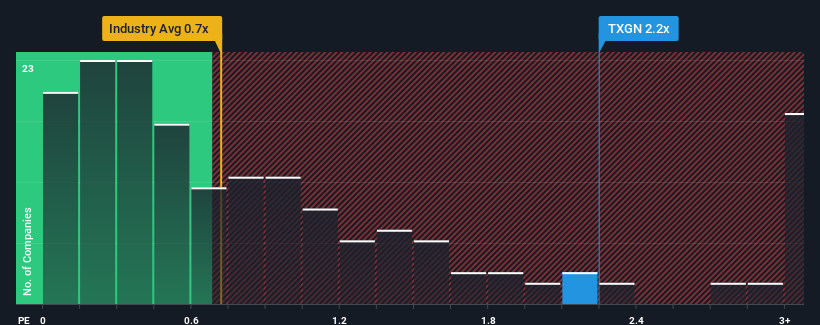
When close to half the companies in the Media industry in Switzerland have price-to-sales ratios (or "P/S") below 0.7x, you may consider TX Group AG (VTX:TXGN) as a stock to potentially avoid with its 2.2x P/S ratio. However, the P/S might be high for a reason and it requires further investigation to determine if it's justified.
Check out our latest analysis for TX Group
How Has TX Group Performed Recently?
TX Group could be doing better as it's been growing revenue less than most other companies lately. It might be that many expect the uninspiring revenue performance to recover significantly, which has kept the P/S ratio from collapsing. However, if this isn't the case, investors might get caught out paying too much for the stock.
Want the full picture on analyst estimates for the company? Then our free report on TX Group will help you uncover what's on the horizon.Do Revenue Forecasts Match The High P/S Ratio?
The only time you'd be truly comfortable seeing a P/S as high as TX Group's is when the company's growth is on track to outshine the industry.
If we review the last year of revenue growth, the company posted a worthy increase of 4.5%. Still, revenue has barely risen at all in aggregate from three years ago, which is not ideal. Accordingly, shareholders probably wouldn't have been overly satisfied with the unstable medium-term growth rates.
Turning to the outlook, the next year should bring diminished returns, with revenue decreasing 2.6% as estimated by the only analyst watching the company. Meanwhile, the broader industry is forecast to expand by 0.3%, which paints a poor picture.
With this information, we find it concerning that TX Group is trading at a P/S higher than the industry. Apparently many investors in the company reject the analyst cohort's pessimism and aren't willing to let go of their stock at any price. Only the boldest would assume these prices are sustainable as these declining revenues are likely to weigh heavily on the share price eventually.
The Bottom Line On TX Group's P/S
Using the price-to-sales ratio alone to determine if you should sell your stock isn't sensible, however it can be a practical guide to the company's future prospects.
Our examination of TX Group's analyst forecasts revealed that its shrinking revenue outlook isn't drawing down its high P/S anywhere near as much as we would have predicted. In cases like this where we see revenue decline on the horizon, we suspect the share price is at risk of following suit, bringing back the high P/S into the realms of suitability. This places shareholders' investments at significant risk and potential investors in danger of paying an excessive premium.
You should always think about risks. Case in point, we've spotted 1 warning sign for TX Group you should be aware of.
If strong companies turning a profit tickle your fancy, then you'll want to check out this free list of interesting companies that trade on a low P/E (but have proven they can grow earnings).
Valuation is complex, but we're here to simplify it.
Discover if TX Group might be undervalued or overvalued with our detailed analysis, featuring fair value estimates, potential risks, dividends, insider trades, and its financial condition.
Access Free AnalysisHave feedback on this article? Concerned about the content? Get in touch with us directly. Alternatively, email editorial-team (at) simplywallst.com.
This article by Simply Wall St is general in nature. We provide commentary based on historical data and analyst forecasts only using an unbiased methodology and our articles are not intended to be financial advice. It does not constitute a recommendation to buy or sell any stock, and does not take account of your objectives, or your financial situation. We aim to bring you long-term focused analysis driven by fundamental data. Note that our analysis may not factor in the latest price-sensitive company announcements or qualitative material. Simply Wall St has no position in any stocks mentioned.
About SWX:TXGN
TX Group
Operates a network of platforms and participations that provides users with information, orientation, entertainment, and other services in Switzerland.
Excellent balance sheet and fair value.
Market Insights

Advertisement
Community Narratives
The Next Phase of Energy Storage: How NeoVolta Is Tackling America’s Power Crunch
Fair Value US$7.50|35.1% undervalued
MA
Community Contributor
Why EnSilica is Worth Possibly 13x its Current Price
Fair Value UK£5.00|89.8% undervalued
DO
Community Contributor
M&A Activity, Industry Diversification & A Defense Contract Monopoly Will Push BWXT For Healthy Long-Term Growth
Fair Value US$220.00|15.2% undervalued
CL
Community Contributor
A case for Cassiar Gold Corp (TSXV: GLDC) to reach CAD$8-10 before 2030 (X30-37)
Fair Value CA$10.00|96.0% undervalued
AG
Community Contributor