
Advertisement
- Switzerland
- /
- Packaging
- /
- SWX:SIGN
SIG Group AG's (VTX:SIGN) Stock On An Uptrend: Could Fundamentals Be Driving The Momentum?

SIG Group's (VTX:SIGN) stock is up by a considerable 13% over the past month. We wonder if and what role the company's financials play in that price change as a company's long-term fundamentals usually dictate market outcomes. In this article, we decided to focus on SIG Group's ROE.
Return on equity or ROE is an important factor to be considered by a shareholder because it tells them how effectively their capital is being reinvested. Simply put, it is used to assess the profitability of a company in relation to its equity capital.
See our latest analysis for SIG Group
How To Calculate Return On Equity?
ROE can be calculated by using the formula:
Return on Equity = Net Profit (from continuing operations) ÷ Shareholders' Equity
So, based on the above formula, the ROE for SIG Group is:
9.2% = €276m ÷ €3.0b (Based on the trailing twelve months to June 2024).
The 'return' is the income the business earned over the last year. One way to conceptualize this is that for each CHF1 of shareholders' capital it has, the company made CHF0.09 in profit.
Why Is ROE Important For Earnings Growth?
So far, we've learned that ROE is a measure of a company's profitability. Based on how much of its profits the company chooses to reinvest or "retain", we are then able to evaluate a company's future ability to generate profits. Assuming all else is equal, companies that have both a higher return on equity and higher profit retention are usually the ones that have a higher growth rate when compared to companies that don't have the same features.
SIG Group's Earnings Growth And 9.2% ROE
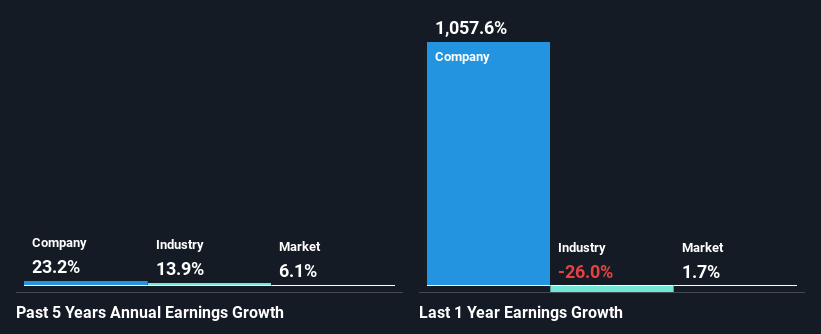
To start with, SIG Group's ROE looks acceptable. Even when compared to the industry average of 9.8% the company's ROE looks quite decent. This certainly adds some context to SIG Group's exceptional 23% net income growth seen over the past five years. However, there could also be other drivers behind this growth. Such as - high earnings retention or an efficient management in place.
Next, on comparing with the industry net income growth, we found that SIG Group's growth is quite high when compared to the industry average growth of 14% in the same period, which is great to see.
Earnings growth is an important metric to consider when valuing a stock. What investors need to determine next is if the expected earnings growth, or the lack of it, is already built into the share price. Doing so will help them establish if the stock's future looks promising or ominous. What is SIGN worth today? The intrinsic value infographic in our free research report helps visualize whether SIGN is currently mispriced by the market.
Is SIG Group Making Efficient Use Of Its Profits?
SIG Group's significant three-year median payout ratio of 92% (where it is retaining only 7.9% of its income) suggests that the company has been able to achieve a high growth in earnings despite returning most of its income to shareholders.
Besides, SIG Group has been paying dividends over a period of six years. This shows that the company is committed to sharing profits with its shareholders. Existing analyst estimates suggest that the company's future payout ratio is expected to drop to 54% over the next three years. The fact that the company's ROE is expected to rise to 11% over the same period is explained by the drop in the payout ratio.
Summary
In total, it does look like SIG Group has some positive aspects to its business. Specifically, its high ROE which likely led to the growth in earnings. Bear in mind, the company reinvests little to none of its profits, which means that investors aren't necessarily reaping the full benefits of the high rate of return. That being so, a study of the latest analyst forecasts show that the company is expected to see a slowdown in its future earnings growth. To know more about the company's future earnings growth forecasts take a look at this free report on analyst forecasts for the company to find out more.
New: Manage All Your Stock Portfolios in One Place
We've created the ultimate portfolio companion for stock investors, and it's free.
• Connect an unlimited number of Portfolios and see your total in one currency
• Be alerted to new Warning Signs or Risks via email or mobile
• Track the Fair Value of your stocks
Have feedback on this article? Concerned about the content? Get in touch with us directly. Alternatively, email editorial-team (at) simplywallst.com.
This article by Simply Wall St is general in nature. We provide commentary based on historical data and analyst forecasts only using an unbiased methodology and our articles are not intended to be financial advice. It does not constitute a recommendation to buy or sell any stock, and does not take account of your objectives, or your financial situation. We aim to bring you long-term focused analysis driven by fundamental data. Note that our analysis may not factor in the latest price-sensitive company announcements or qualitative material. Simply Wall St has no position in any stocks mentioned.
About SWX:SIGN
SIG Group
Provides aseptic carton packaging systems and solutions for beverage and liquid food products.
Mediocre balance sheet low.
Similar Companies
Market Insights


Advertisement
Community Narratives
MicroStrategy: Volatile Gamble or Golden Opportunity?
Fair Value US$663.00|32.0% undervalued
BL
Community Contributor
Emerging Markets and Debt Reduction Will Propel Bath & Body Works Forward
Fair Value US$40.73|21.7% undervalued
ZW
Community Contributor
An amazing opportunity to potentially get a 100 bagger
Fair Value US$10.00|0.5% overvalued
DA
Community Contributor