- Switzerland
- /
- Medical Equipment
- /
- SWX:MOVE
Earnings grew faster than the respectable 12% CAGR delivered to Medacta Group (VTX:MOVE) shareholders over the last three years


One simple way to benefit from the stock market is to buy an index fund. But if you buy good businesses at attractive prices, your portfolio returns could exceed the average market return. For example, Medacta Group SA (VTX:MOVE) shareholders have seen the share price rise 37% over three years, well in excess of the market return (13%, not including dividends).
Although Medacta Group has shed CHF92m from its market cap this week, let's take a look at its longer term fundamental trends and see if they've driven returns.
View our latest analysis for Medacta Group
In his essay The Superinvestors of Graham-and-Doddsville Warren Buffett described how share prices do not always rationally reflect the value of a business. One flawed but reasonable way to assess how sentiment around a company has changed is to compare the earnings per share (EPS) with the share price.
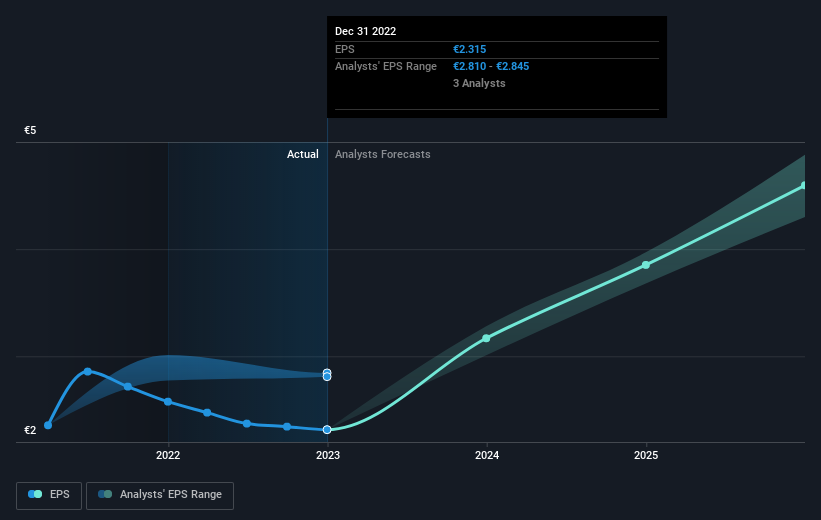
During three years of share price growth, Medacta Group achieved compound earnings per share growth of 58% per year. The average annual share price increase of 11% is actually lower than the EPS growth. Therefore, it seems the market has moderated its expectations for growth, somewhat.
The image below shows how EPS has tracked over time (if you click on the image you can see greater detail).
We know that Medacta Group has improved its bottom line over the last three years, but what does the future have in store? It might be well worthwhile taking a look at our free report on how its financial position has changed over time.
A Different Perspective
Over the last year, Medacta Group shareholders took a loss of 2.5%, including dividends. In contrast the market gained about 1.1%. However, keep in mind that even the best stocks will sometimes underperform the market over a twelve month period. Fortunately the longer term story is brighter, with total returns averaging about 12% per year over three years. The recent sell-off could be an opportunity if the business remains sound, so it may be worth checking the fundamental data for signs of a long-term growth trend. It's always interesting to track share price performance over the longer term. But to understand Medacta Group better, we need to consider many other factors. Consider for instance, the ever-present spectre of investment risk. We've identified 1 warning sign with Medacta Group , and understanding them should be part of your investment process.
Of course, you might find a fantastic investment by looking elsewhere. So take a peek at this free list of companies we expect will grow earnings.
Please note, the market returns quoted in this article reflect the market weighted average returns of stocks that currently trade on Swiss exchanges.
If you're looking to trade Medacta Group, open an account with the lowest-cost platform trusted by professionals, Interactive Brokers.
With clients in over 200 countries and territories, and access to 160 markets, IBKR lets you trade stocks, options, futures, forex, bonds and funds from a single integrated account.
Enjoy no hidden fees, no account minimums, and FX conversion rates as low as 0.03%, far better than what most brokers offer.
Sponsored ContentNew: Manage All Your Stock Portfolios in One Place
We've created the ultimate portfolio companion for stock investors, and it's free.
• Connect an unlimited number of Portfolios and see your total in one currency
• Be alerted to new Warning Signs or Risks via email or mobile
• Track the Fair Value of your stocks
Have feedback on this article? Concerned about the content? Get in touch with us directly. Alternatively, email editorial-team (at) simplywallst.com.
This article by Simply Wall St is general in nature. We provide commentary based on historical data and analyst forecasts only using an unbiased methodology and our articles are not intended to be financial advice. It does not constitute a recommendation to buy or sell any stock, and does not take account of your objectives, or your financial situation. We aim to bring you long-term focused analysis driven by fundamental data. Note that our analysis may not factor in the latest price-sensitive company announcements or qualitative material. Simply Wall St has no position in any stocks mentioned.
About SWX:MOVE
Medacta Group
Develops, manufactures, and distributes orthopedic and neurosurgical medical devices Latin America, North America, the Asia-Pacific, and Middle East and Africa.
Solid track record with excellent balance sheet.
Similar Companies
Market Insights

Community Narratives

