
If you're not sure where to start when looking for the next multi-bagger, there are a few key trends you should keep an eye out for. Firstly, we'll want to see a proven return on capital employed (ROCE) that is increasing, and secondly, an expanding base of capital employed. This shows us that it's a compounding machine, able to continually reinvest its earnings back into the business and generate higher returns. So on that note, Ascom Holding (VTX:ASCN) looks quite promising in regards to its trends of return on capital.
What Is Return On Capital Employed (ROCE)?
For those who don't know, ROCE is a measure of a company's yearly pre-tax profit (its return), relative to the capital employed in the business. Analysts use this formula to calculate it for Ascom Holding:
Return on Capital Employed = Earnings Before Interest and Tax (EBIT) ÷ (Total Assets - Current Liabilities)
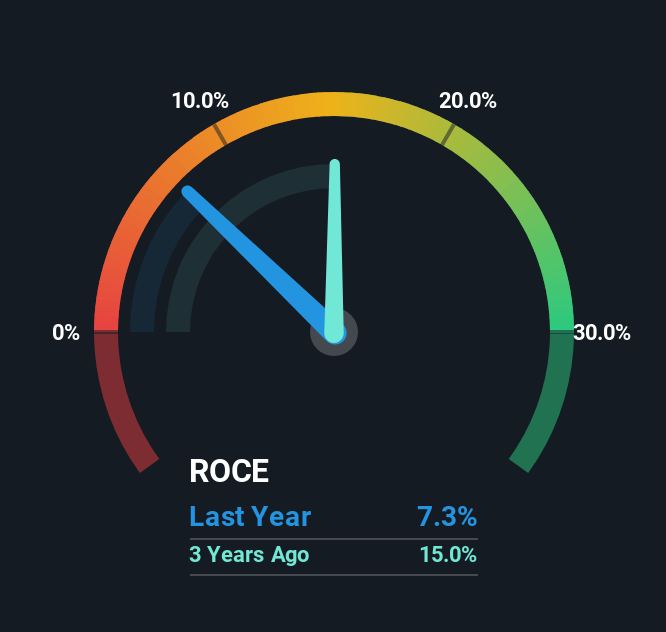
0.073 = CHF7.6m ÷ (CHF190m - CHF86m) (Based on the trailing twelve months to December 2024).
Thus, Ascom Holding has an ROCE of 7.3%. Ultimately, that's a low return and it under-performs the Healthcare Services industry average of 13%.
View our latest analysis for Ascom Holding
Above you can see how the current ROCE for Ascom Holding compares to its prior returns on capital, but there's only so much you can tell from the past. If you'd like to see what analysts are forecasting going forward, you should check out our free analyst report for Ascom Holding .
What Does the ROCE Trend For Ascom Holding Tell Us?
Ascom Holding has broken into the black (profitability) and we're sure it's a sight for sore eyes. The company now earns 7.3% on its capital, because five years ago it was incurring losses. On top of that, what's interesting is that the amount of capital being employed has remained steady, so the business hasn't needed to put any additional money to work to generate these higher returns. So while we're happy that the business is more efficient, just keep in mind that could mean that going forward the business is lacking areas to invest internally for growth. So if you're looking for high growth, you'll want to see a business's capital employed also increasing.
On a related note, the company's ratio of current liabilities to total assets has decreased to 45%, which basically reduces it's funding from the likes of short-term creditors or suppliers. So this improvement in ROCE has come from the business' underlying economics, which is great to see. However, current liabilities are still at a pretty high level, so just be aware that this can bring with it some risks.
What We Can Learn From Ascom Holding's ROCE
In summary, we're delighted to see that Ascom Holding has been able to increase efficiencies and earn higher rates of return on the same amount of capital. Given the stock has declined 45% in the last five years, this could be a good investment if the valuation and other metrics are also appealing. That being the case, research into the company's current valuation metrics and future prospects seems fitting.
One more thing to note, we've identified 2 warning signs with Ascom Holding and understanding these should be part of your investment process.
While Ascom Holding isn't earning the highest return, check out this free list of companies that are earning high returns on equity with solid balance sheets.
The New Payments ETF Is Live on NASDAQ:
Money is moving to real-time rails, and a newly listed ETF now gives investors direct exposure. Fast settlement. Institutional custody. Simple access.
Explore how this launch could reshape portfolios
Sponsored ContentNew: Manage All Your Stock Portfolios in One Place
We've created the ultimate portfolio companion for stock investors, and it's free.
• Connect an unlimited number of Portfolios and see your total in one currency
• Be alerted to new Warning Signs or Risks via email or mobile
• Track the Fair Value of your stocks
Have feedback on this article? Concerned about the content? Get in touch with us directly. Alternatively, email editorial-team (at) simplywallst.com.
This article by Simply Wall St is general in nature. We provide commentary based on historical data and analyst forecasts only using an unbiased methodology and our articles are not intended to be financial advice. It does not constitute a recommendation to buy or sell any stock, and does not take account of your objectives, or your financial situation. We aim to bring you long-term focused analysis driven by fundamental data. Note that our analysis may not factor in the latest price-sensitive company announcements or qualitative material. Simply Wall St has no position in any stocks mentioned.
About SWX:ASCN
Ascom Holding
Provides healthcare ICT and mobile workflow solutions worldwide.
Flawless balance sheet with moderate growth potential.
Similar Companies
Market Insights

Weekly Picks

Early mover in a fast growing industry. Likely to experience share price volatility as they scale


A case for CA$31.80 (undiluted), aka 8,616% upside from CA$0.37 (an 86 bagger!).


Moderation and Stabilisation: HOLD: Fair Price based on a 4-year Cycle is $12.08
Recently Updated Narratives


An amazing opportunity to potentially get a 100 bagger

Amazon: Why the World’s Biggest Platform Still Runs on Invisible Economics

Sunrun Stock: When the Energy Transition Collides With the Cost of Capital
Popular Narratives


MicroVision will explode future revenue by 380.37% with a vision towards success


Crazy Undervalued 42 Baggers Silver Play (Active & Running Mine)


NVDA: Expanding AI Demand Will Drive Major Data Center Investments Through 2026
Trending Discussion
