
Advertisement
- Switzerland
- /
- Food and Staples Retail
- /
- SWX:VILN
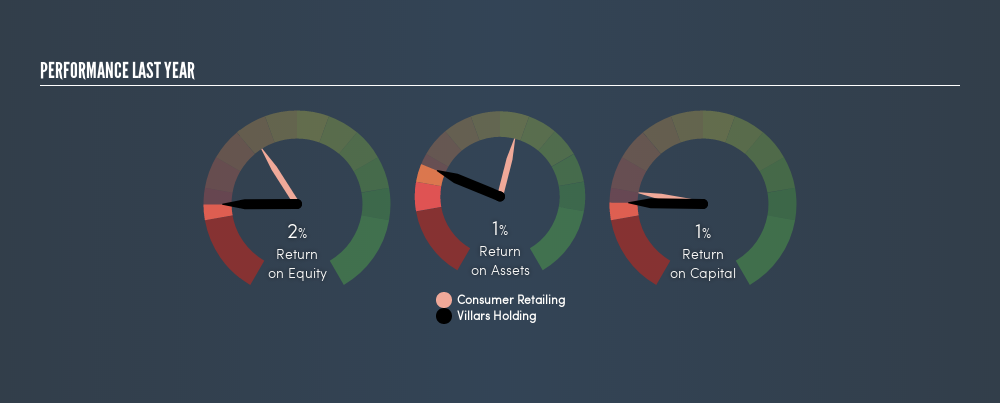
Villars Holding S.A.’s (VTX:VILN) Investment Returns Are Lagging Its Industry

Today we'll evaluate Villars Holding S.A. (VTX:VILN) to determine whether it could have potential as an investment idea. In particular, we'll consider its Return On Capital Employed (ROCE), as that can give us insight into how profitably the company is able to employ capital in its business.
First, we'll go over how we calculate ROCE. Next, we'll compare it to others in its industry. And finally, we'll look at how its current liabilities are impacting its ROCE.
Understanding Return On Capital Employed (ROCE)
ROCE is a measure of a company's yearly pre-tax profit (its return), relative to the capital employed in the business. In general, businesses with a higher ROCE are usually better quality. In brief, it is a useful tool, but it is not without drawbacks. Renowned investment researcher Michael Mauboussin has suggested that a high ROCE can indicate that 'one dollar invested in the company generates value of more than one dollar'.
How Do You Calculate Return On Capital Employed?
The formula for calculating the return on capital employed is:
Return on Capital Employed = Earnings Before Interest and Tax (EBIT) ÷ (Total Assets - Current Liabilities)
Or for Villars Holding:
0.013 = CHF1.3m ÷ (CHF111m - CHF9.2m) (Based on the trailing twelve months to December 2018.)
So, Villars Holding has an ROCE of 1.3%.
Want to participate in a short research study? Help shape the future of investing tools and you could win a $250 gift card!
View our latest analysis for Villars Holding
Does Villars Holding Have A Good ROCE?
One way to assess ROCE is to compare similar companies. In this analysis, Villars Holding's ROCE appears meaningfully below the 9.0% average reported by the Consumer Retailing industry. This performance could be negative if sustained, as it suggests the business may underperform its industry. Independently of how Villars Holding compares to its industry, its ROCE in absolute terms is low; especially compared to the ~3.3% available in government bonds. There are potentially more appealing investments elsewhere.
Villars Holding's current ROCE of 1.3% is lower than 3 years ago, when the company reported a 2.4% ROCE. Therefore we wonder if the company is facing new headwinds.
Remember that this metric is backwards looking - it shows what has happened in the past, and does not accurately predict the future. Companies in cyclical industries can be difficult to understand using ROCE, as returns typically look high during boom times, and low during busts. ROCE is only a point-in-time measure. If Villars Holding is cyclical, it could make sense to check out this free graph of past earnings, revenue and cash flow.
Villars Holding's Current Liabilities And Their Impact On Its ROCE
Liabilities, such as supplier bills and bank overdrafts, are referred to as current liabilities if they need to be paid within 12 months. Due to the way ROCE is calculated, a high level of current liabilities makes a company look as though it has less capital employed, and thus can (sometimes unfairly) boost the ROCE. To check the impact of this, we calculate if a company has high current liabilities relative to its total assets.
Villars Holding has total assets of CHF111m and current liabilities of CHF9.2m. Therefore its current liabilities are equivalent to approximately 8.3% of its total assets. Villars Holding has very few current liabilities, which have a minimal effect on its already low ROCE.
The Bottom Line On Villars Holding's ROCE
Still, investors could probably find more attractive prospects with better performance out there. Of course, you might find a fantastic investment by looking at a few good candidates. So take a peek at this free list of companies with modest (or no) debt, trading on a P/E below 20.
If you are like me, then you will not want to miss this free list of growing companies that insiders are buying.
We aim to bring you long-term focused research analysis driven by fundamental data. Note that our analysis may not factor in the latest price-sensitive company announcements or qualitative material.
If you spot an error that warrants correction, please contact the editor at editorial-team@simplywallst.com. This article by Simply Wall St is general in nature. It does not constitute a recommendation to buy or sell any stock, and does not take account of your objectives, or your financial situation. Simply Wall St has no position in the stocks mentioned. Thank you for reading.
About SWX:VILN
Villars Holding
Engages in the retail, coffee bars, and real estate and other businesses in Switzerland.
Solid track record with mediocre balance sheet.
Market Insights


Advertisement
Community Narratives
The Future of Drug Testing? Fingerprint Tech Shows Serious Promise
Fair Value US$2.98|43.0% undervalued
JO
Community Contributor
Suncorp’s Next Chapter: Insurance-Only and Ready to Grow
Fair Value AU$22.83|7.6% undervalued
RO
Community Contributor
Thyssenkrupp Nucera Will Achieve Double-Digit Profits by 2030 Boosted by Hydrogen Growth
Fair Value €14.40|30.6% undervalued
CH
Community Contributor
Tesla’s Nvidia Moment – The AI & Robotics Inflection Point
Fair Value US$359.72|18.3% undervalued
BL
Community Contributor