
Advertisement
- Canada
- /
- Infrastructure
- /
- TSX:WTE
Are Westshore Terminals Investment Corporation (TSE:WTE) Investors Paying Above The Intrinsic Value?
Key Insights
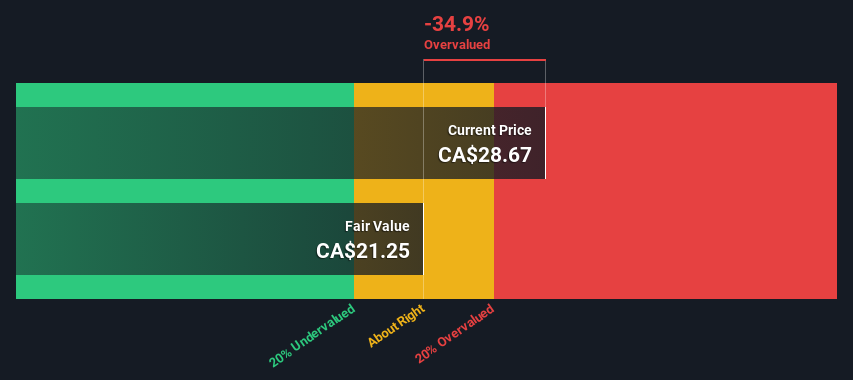
- The projected fair value for Westshore Terminals Investment is CA$21.25 based on 2 Stage Free Cash Flow to Equity
- Westshore Terminals Investment's CA$28.67 share price signals that it might be 35% overvalued
- Our fair value estimate is 22% lower than Westshore Terminals Investment's analyst price target of CA$27.25
Does the January share price for Westshore Terminals Investment Corporation (TSE:WTE) reflect what it's really worth? Today, we will estimate the stock's intrinsic value by taking the expected future cash flows and discounting them to today's value. Our analysis will employ the Discounted Cash Flow (DCF) model. Don't get put off by the jargon, the math behind it is actually quite straightforward.
We generally believe that a company's value is the present value of all of the cash it will generate in the future. However, a DCF is just one valuation metric among many, and it is not without flaws. For those who are keen learners of equity analysis, the Simply Wall St analysis model here may be something of interest to you.
View our latest analysis for Westshore Terminals Investment
Crunching The Numbers
We're using the 2-stage growth model, which simply means we take in account two stages of company's growth. In the initial period the company may have a higher growth rate and the second stage is usually assumed to have a stable growth rate. To begin with, we have to get estimates of the next ten years of cash flows. Where possible we use analyst estimates, but when these aren't available we extrapolate the previous free cash flow (FCF) from the last estimate or reported value. We assume companies with shrinking free cash flow will slow their rate of shrinkage, and that companies with growing free cash flow will see their growth rate slow, over this period. We do this to reflect that growth tends to slow more in the early years than it does in later years.
Generally we assume that a dollar today is more valuable than a dollar in the future, and so the sum of these future cash flows is then discounted to today's value:
10-year free cash flow (FCF) forecast
| 2024 | 2025 | 2026 | 2027 | 2028 | 2029 | 2030 | 2031 | 2032 | 2033 | |
| Levered FCF (CA$, Millions) | CA$118.5m | CA$103.7m | CA$95.4m | CA$90.6m | CA$87.9m | CA$86.6m | CA$86.2m | CA$86.5m | CA$87.1m | CA$88.1m |
| Growth Rate Estimate Source | Analyst x4 | Analyst x3 | Est @ -8.00% | Est @ -5.02% | Est @ -2.94% | Est @ -1.48% | Est @ -0.45% | Est @ 0.26% | Est @ 0.76% | Est @ 1.11% |
| Present Value (CA$, Millions) Discounted @ 8.0% | CA$110 | CA$88.9 | CA$75.8 | CA$66.7 | CA$59.9 | CA$54.7 | CA$50.4 | CA$46.8 | CA$43.7 | CA$40.9 |
("Est" = FCF growth rate estimated by Simply Wall St)
Present Value of 10-year Cash Flow (PVCF) = CA$638m
We now need to calculate the Terminal Value, which accounts for all the future cash flows after this ten year period. For a number of reasons a very conservative growth rate is used that cannot exceed that of a country's GDP growth. In this case we have used the 5-year average of the 10-year government bond yield (1.9%) to estimate future growth. In the same way as with the 10-year 'growth' period, we discount future cash flows to today's value, using a cost of equity of 8.0%.
Terminal Value (TV)= FCF2033 × (1 + g) ÷ (r – g) = CA$88m× (1 + 1.9%) ÷ (8.0%– 1.9%) = CA$1.5b
Present Value of Terminal Value (PVTV)= TV / (1 + r)10= CA$1.5b÷ ( 1 + 8.0%)10= CA$691m
The total value is the sum of cash flows for the next ten years plus the discounted terminal value, which results in the Total Equity Value, which in this case is CA$1.3b. The last step is to then divide the equity value by the number of shares outstanding. Relative to the current share price of CA$28.7, the company appears potentially overvalued at the time of writing. The assumptions in any calculation have a big impact on the valuation, so it is better to view this as a rough estimate, not precise down to the last cent.
Important Assumptions
The calculation above is very dependent on two assumptions. The first is the discount rate and the other is the cash flows. If you don't agree with these result, have a go at the calculation yourself and play with the assumptions. The DCF also does not consider the possible cyclicality of an industry, or a company's future capital requirements, so it does not give a full picture of a company's potential performance. Given that we are looking at Westshore Terminals Investment as potential shareholders, the cost of equity is used as the discount rate, rather than the cost of capital (or weighted average cost of capital, WACC) which accounts for debt. In this calculation we've used 8.0%, which is based on a levered beta of 1.208. Beta is a measure of a stock's volatility, compared to the market as a whole. We get our beta from the industry average beta of globally comparable companies, with an imposed limit between 0.8 and 2.0, which is a reasonable range for a stable business.
SWOT Analysis for Westshore Terminals Investment
Strength
- Earnings growth over the past year exceeded its 5-year average.
- Currently debt free.
Weakness
- Earnings growth over the past year underperformed the Infrastructure industry.
- Dividend is low compared to the top 25% of dividend payers in the Infrastructure market.
- Expensive based on P/E ratio and estimated fair value.
Opportunity
- Significant insider buying over the past 3 months.
Threat
- Dividends are not covered by cash flow.
- Annual earnings are forecast to decline for the next 3 years.
Next Steps:
Although the valuation of a company is important, it ideally won't be the sole piece of analysis you scrutinize for a company. It's not possible to obtain a foolproof valuation with a DCF model. Instead the best use for a DCF model is to test certain assumptions and theories to see if they would lead to the company being undervalued or overvalued. If a company grows at a different rate, or if its cost of equity or risk free rate changes sharply, the output can look very different. What is the reason for the share price exceeding the intrinsic value? For Westshore Terminals Investment, we've put together three pertinent aspects you should look at:
- Risks: To that end, you should learn about the 2 warning signs we've spotted with Westshore Terminals Investment (including 1 which shouldn't be ignored) .
- Future Earnings: How does WTE's growth rate compare to its peers and the wider market? Dig deeper into the analyst consensus number for the upcoming years by interacting with our free analyst growth expectation chart.
- Other Solid Businesses: Low debt, high returns on equity and good past performance are fundamental to a strong business. Why not explore our interactive list of stocks with solid business fundamentals to see if there are other companies you may not have considered!
PS. The Simply Wall St app conducts a discounted cash flow valuation for every stock on the TSX every day. If you want to find the calculation for other stocks just search here.
Valuation is complex, but we're here to simplify it.
Discover if Westshore Terminals Investment might be undervalued or overvalued with our detailed analysis, featuring fair value estimates, potential risks, dividends, insider trades, and its financial condition.
Access Free AnalysisHave feedback on this article? Concerned about the content? Get in touch with us directly. Alternatively, email editorial-team (at) simplywallst.com.
This article by Simply Wall St is general in nature. We provide commentary based on historical data and analyst forecasts only using an unbiased methodology and our articles are not intended to be financial advice. It does not constitute a recommendation to buy or sell any stock, and does not take account of your objectives, or your financial situation. We aim to bring you long-term focused analysis driven by fundamental data. Note that our analysis may not factor in the latest price-sensitive company announcements or qualitative material. Simply Wall St has no position in any stocks mentioned.
About TSX:WTE
Westshore Terminals Investment
Operates a coal storage and unloading/loading terminal at Roberts Bank, British Columbia.
Established dividend payer with adequate balance sheet.
Market Insights

Advertisement
Community Narratives
The Next Phase of Energy Storage: How NeoVolta Is Tackling America’s Power Crunch
Fair Value US$7.50|35.1% undervalued
MA
Community Contributor
Why EnSilica is Worth Possibly 13x its Current Price
Fair Value UK£5.00|89.8% undervalued
DO
Community Contributor
M&A Activity, Industry Diversification & A Defense Contract Monopoly Will Push BWXT For Healthy Long-Term Growth
Fair Value US$220.00|15.2% undervalued
CL
Community Contributor
A case for Cassiar Gold Corp (TSXV: GLDC) to reach CAD$8-10 before 2030 (X30-37)
Fair Value CA$10.00|96.0% undervalued
AG
Community Contributor